
Global App Store Market Overview

An overview on the global app market that covers consumer spending, market sizes and the latest trends.
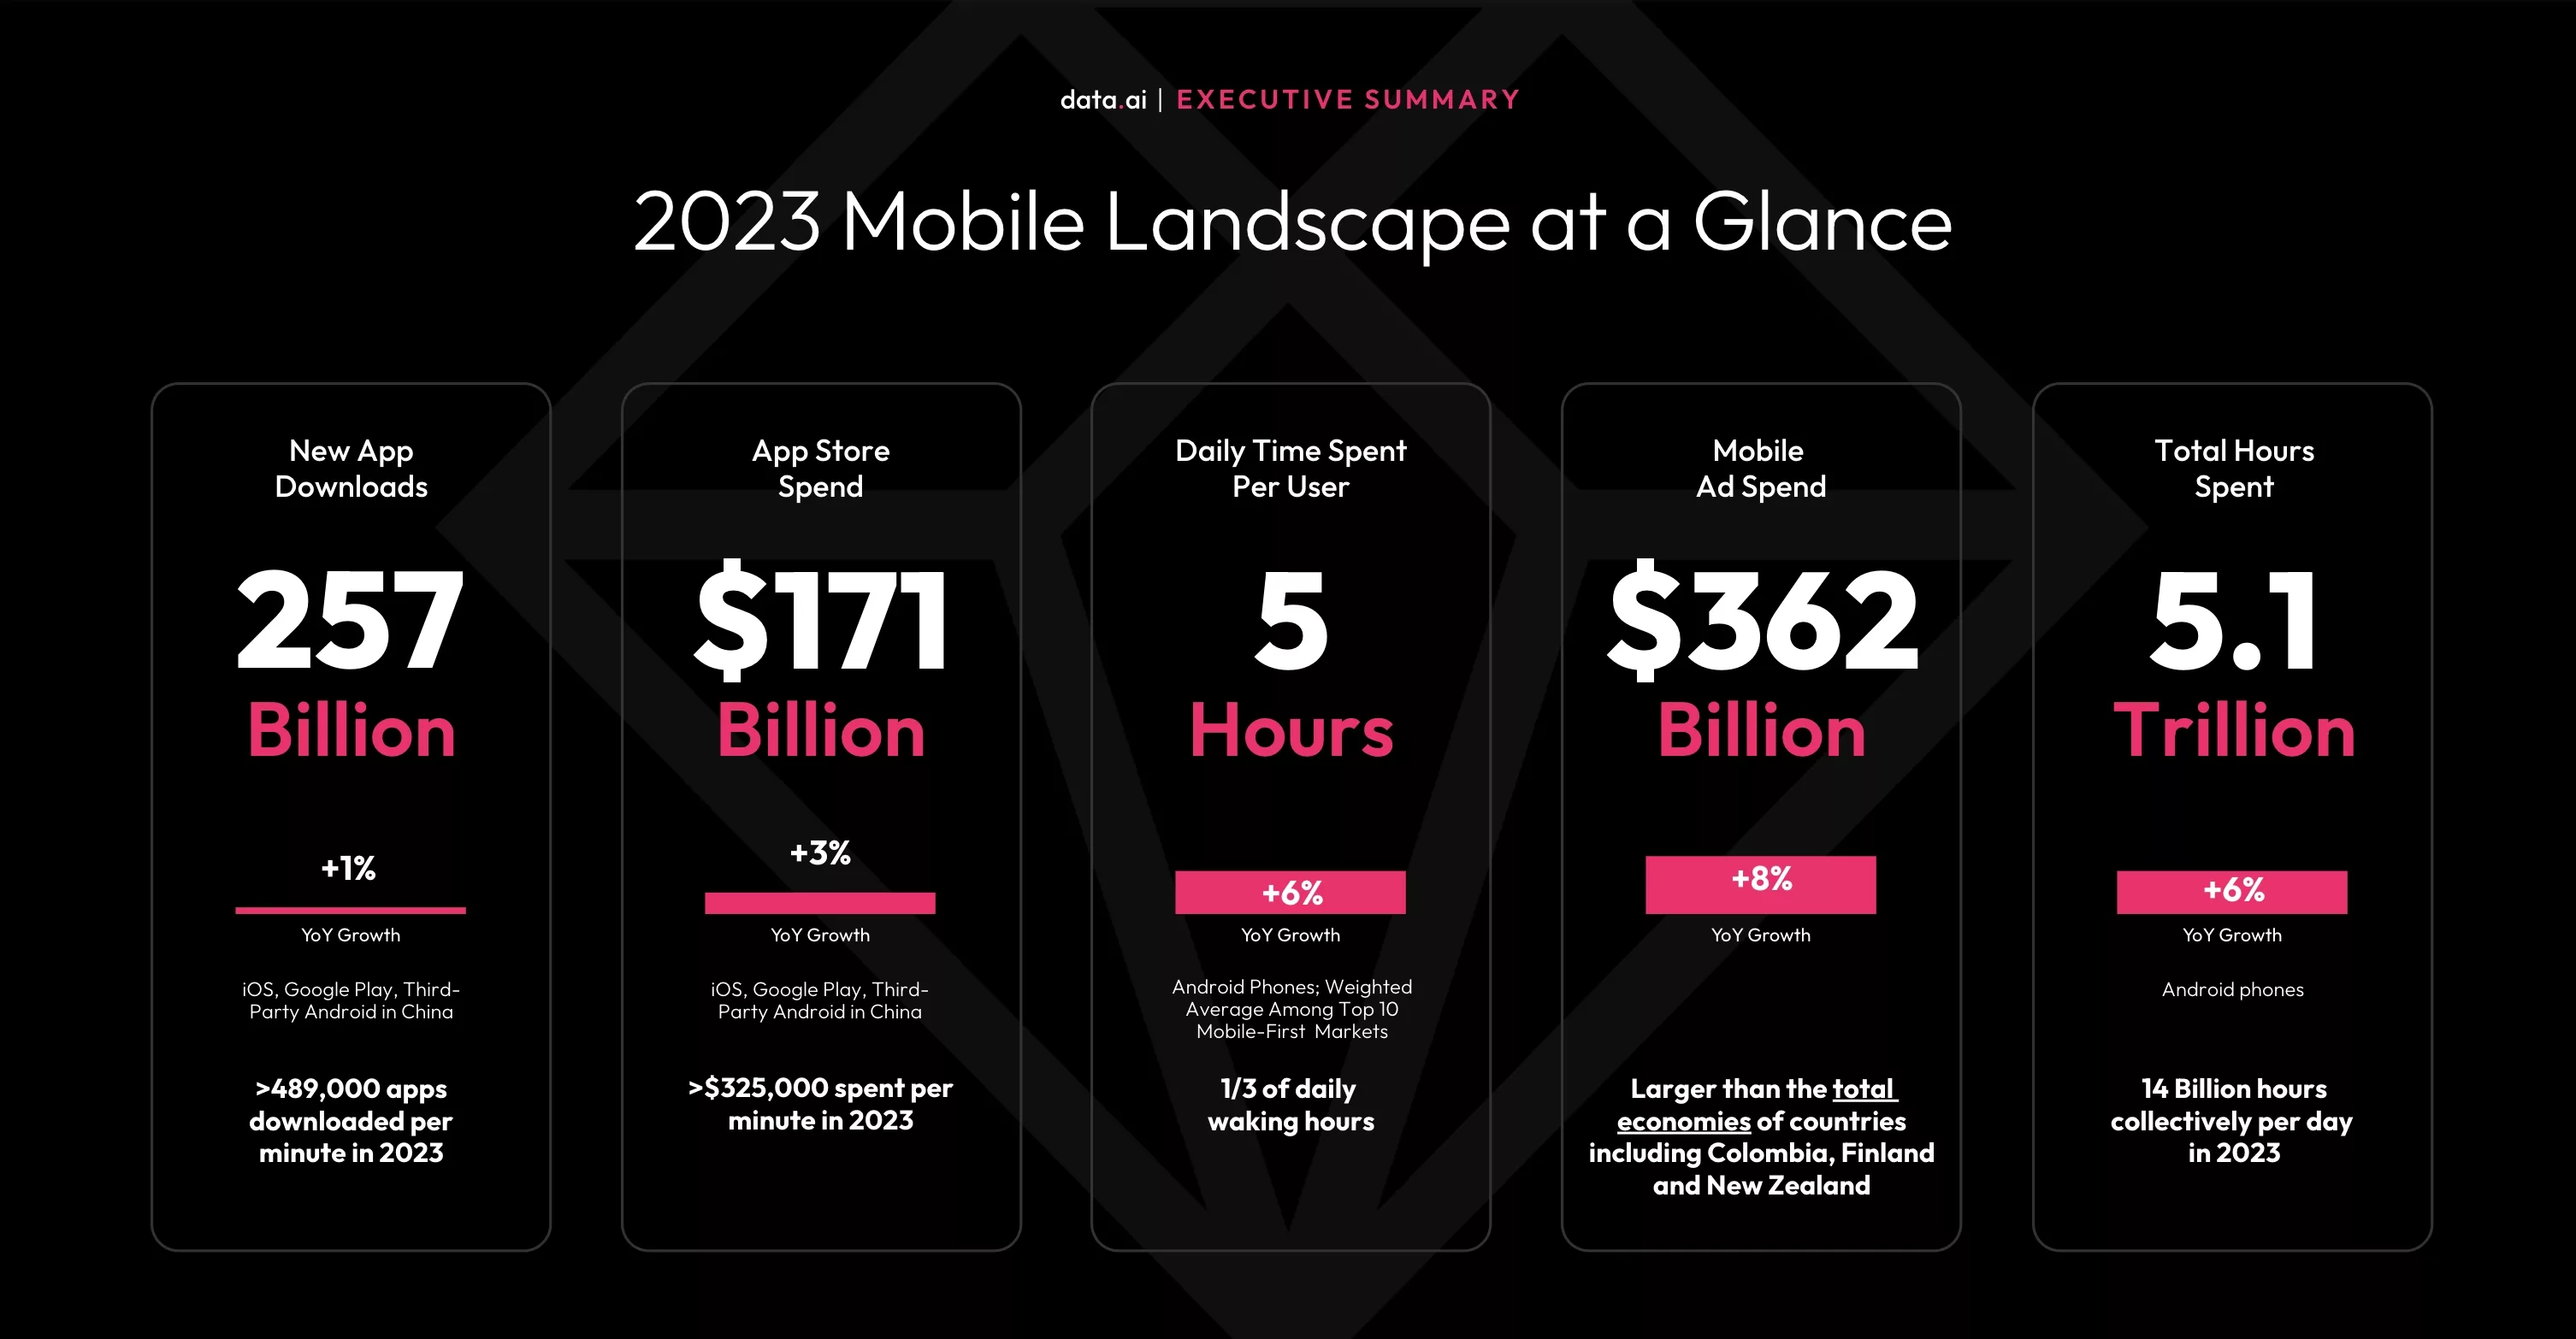
2023 Mobile Landscape at a glance.
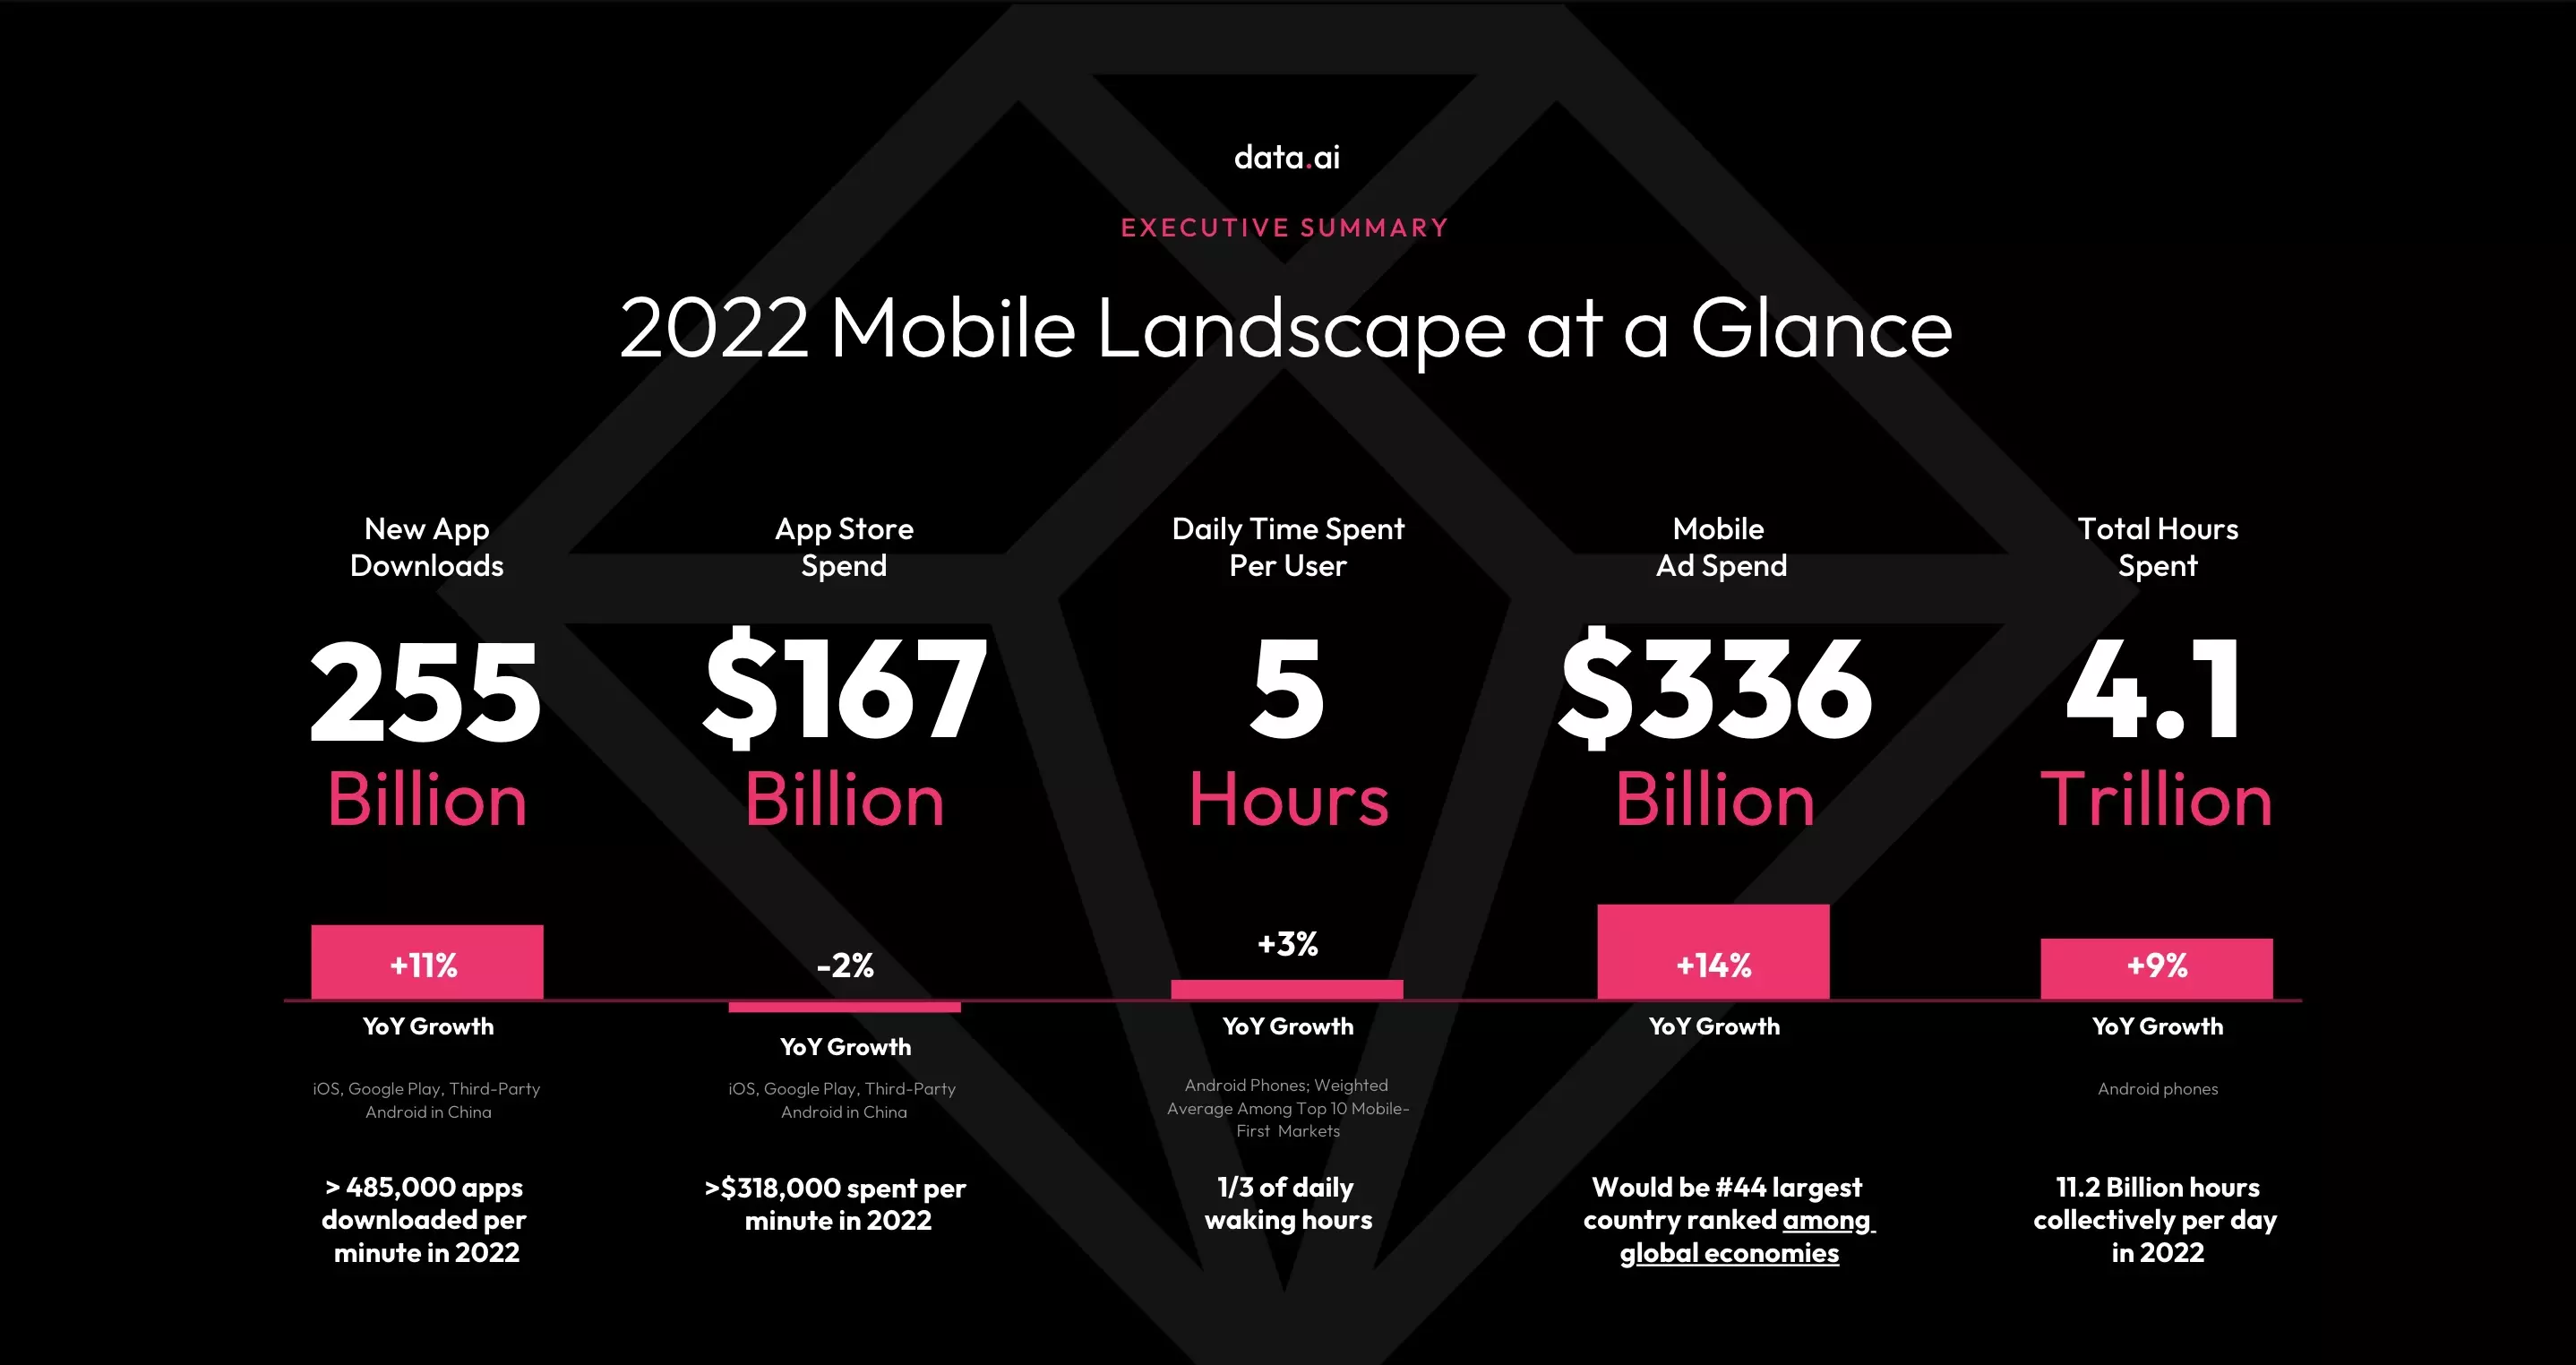
2022 Mobile Landscape at a glance.
Global App Store market statistics from 2023 demonstrate that the landscape is extremely competitive with consumers:
- Downloading 257 billion apps (+1% YoY growth).
- Spending $171 billion (+3% YoY growth).
- Spending 5 hours per day in-apps (+6% YoY growth).
- Spending 5.1 trillion hours total (+6% YoY growth).
Mobile ad spend continues to prove to be a valuable source of income generating $362 billion (+8% YoY growth).
Sources: Data AI (2023), Data AI (2024).
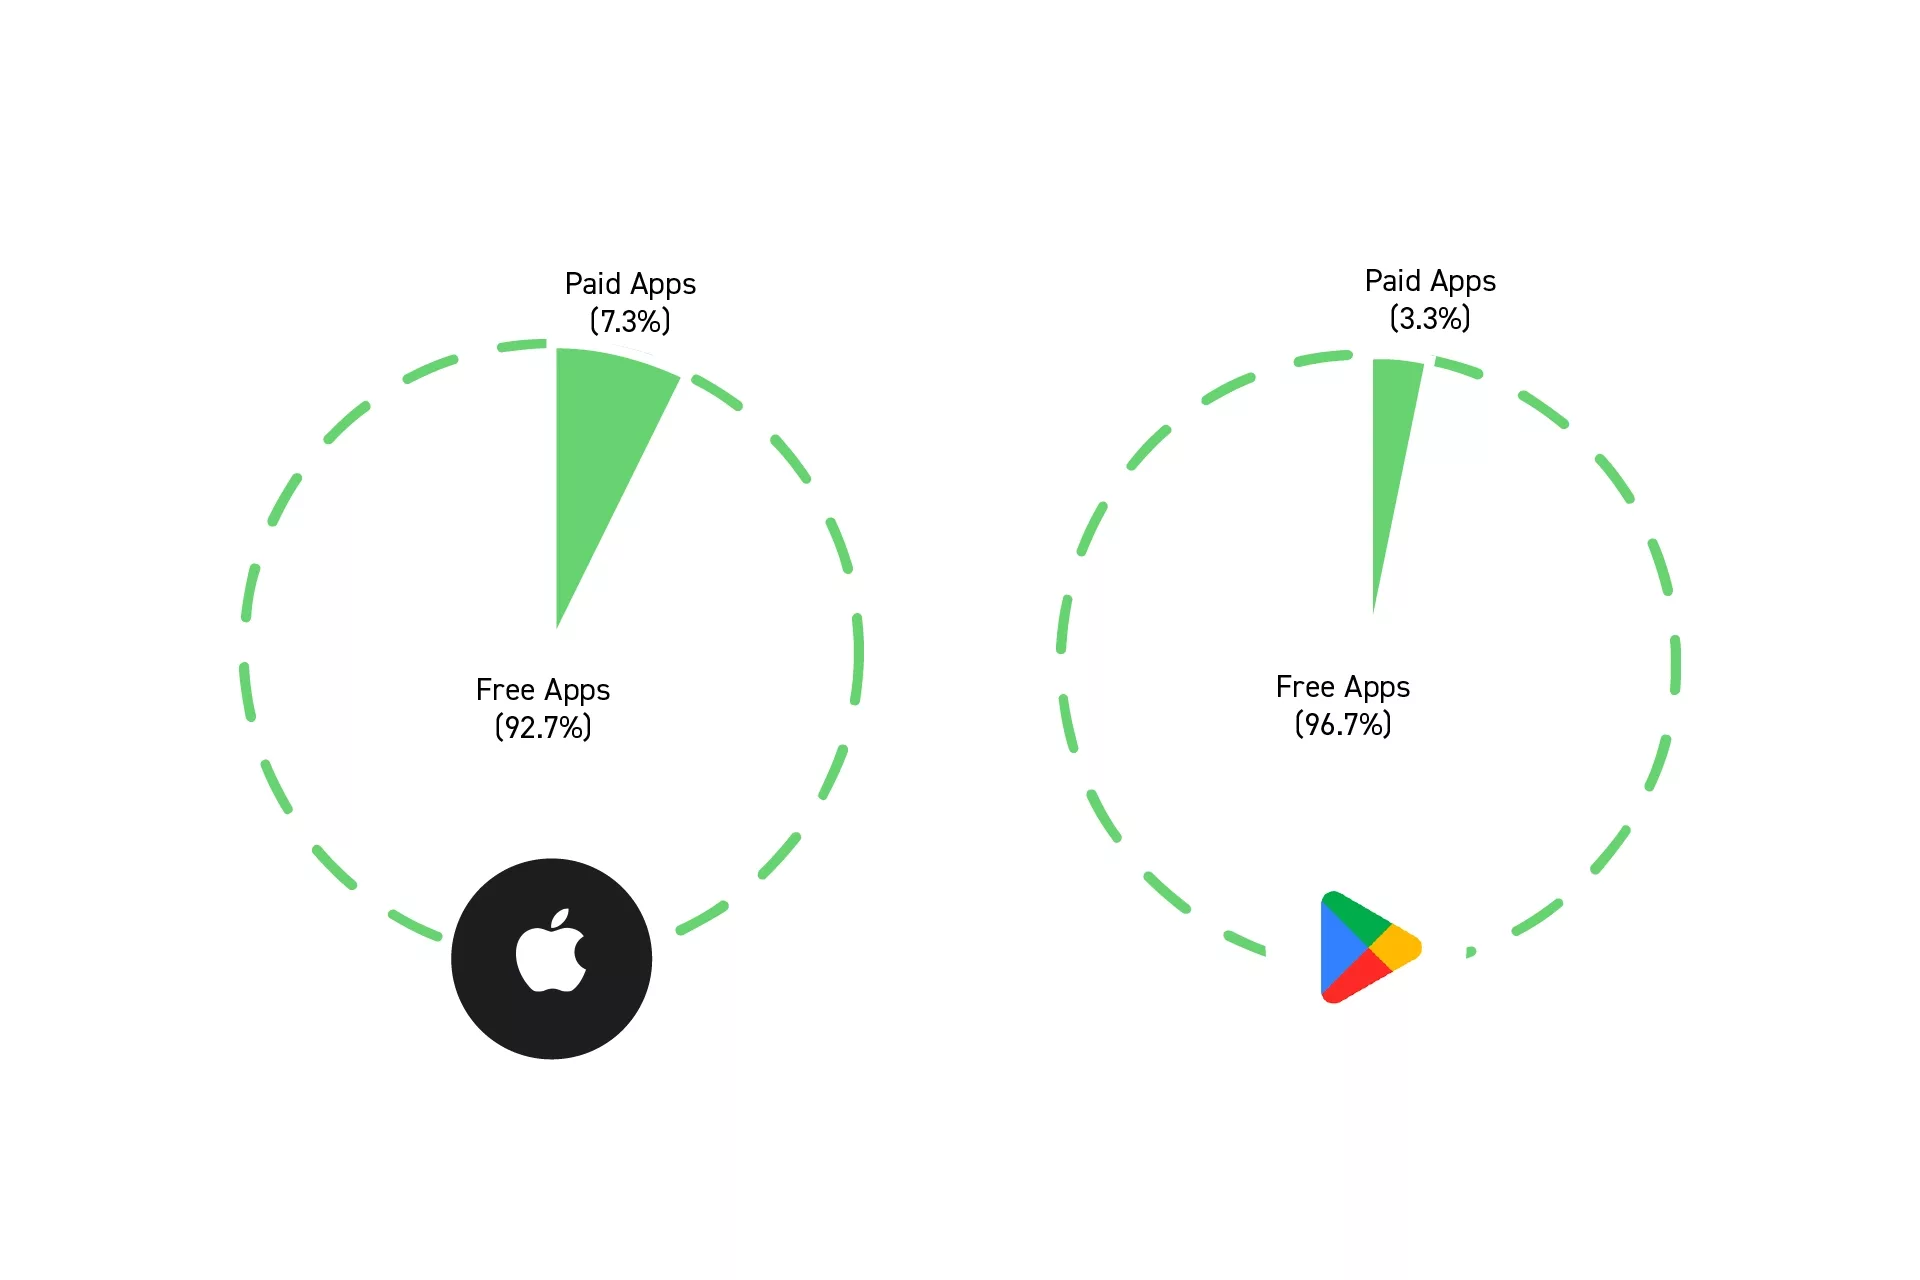
In terms of paid vs free, freemium is still the leading business model with:
- 92.7% of apps on the Apple App Stores are free.
- 96.7% of apps on the Google play store are free and accounting for 98% of total revenue.
Sources: Business of Apps
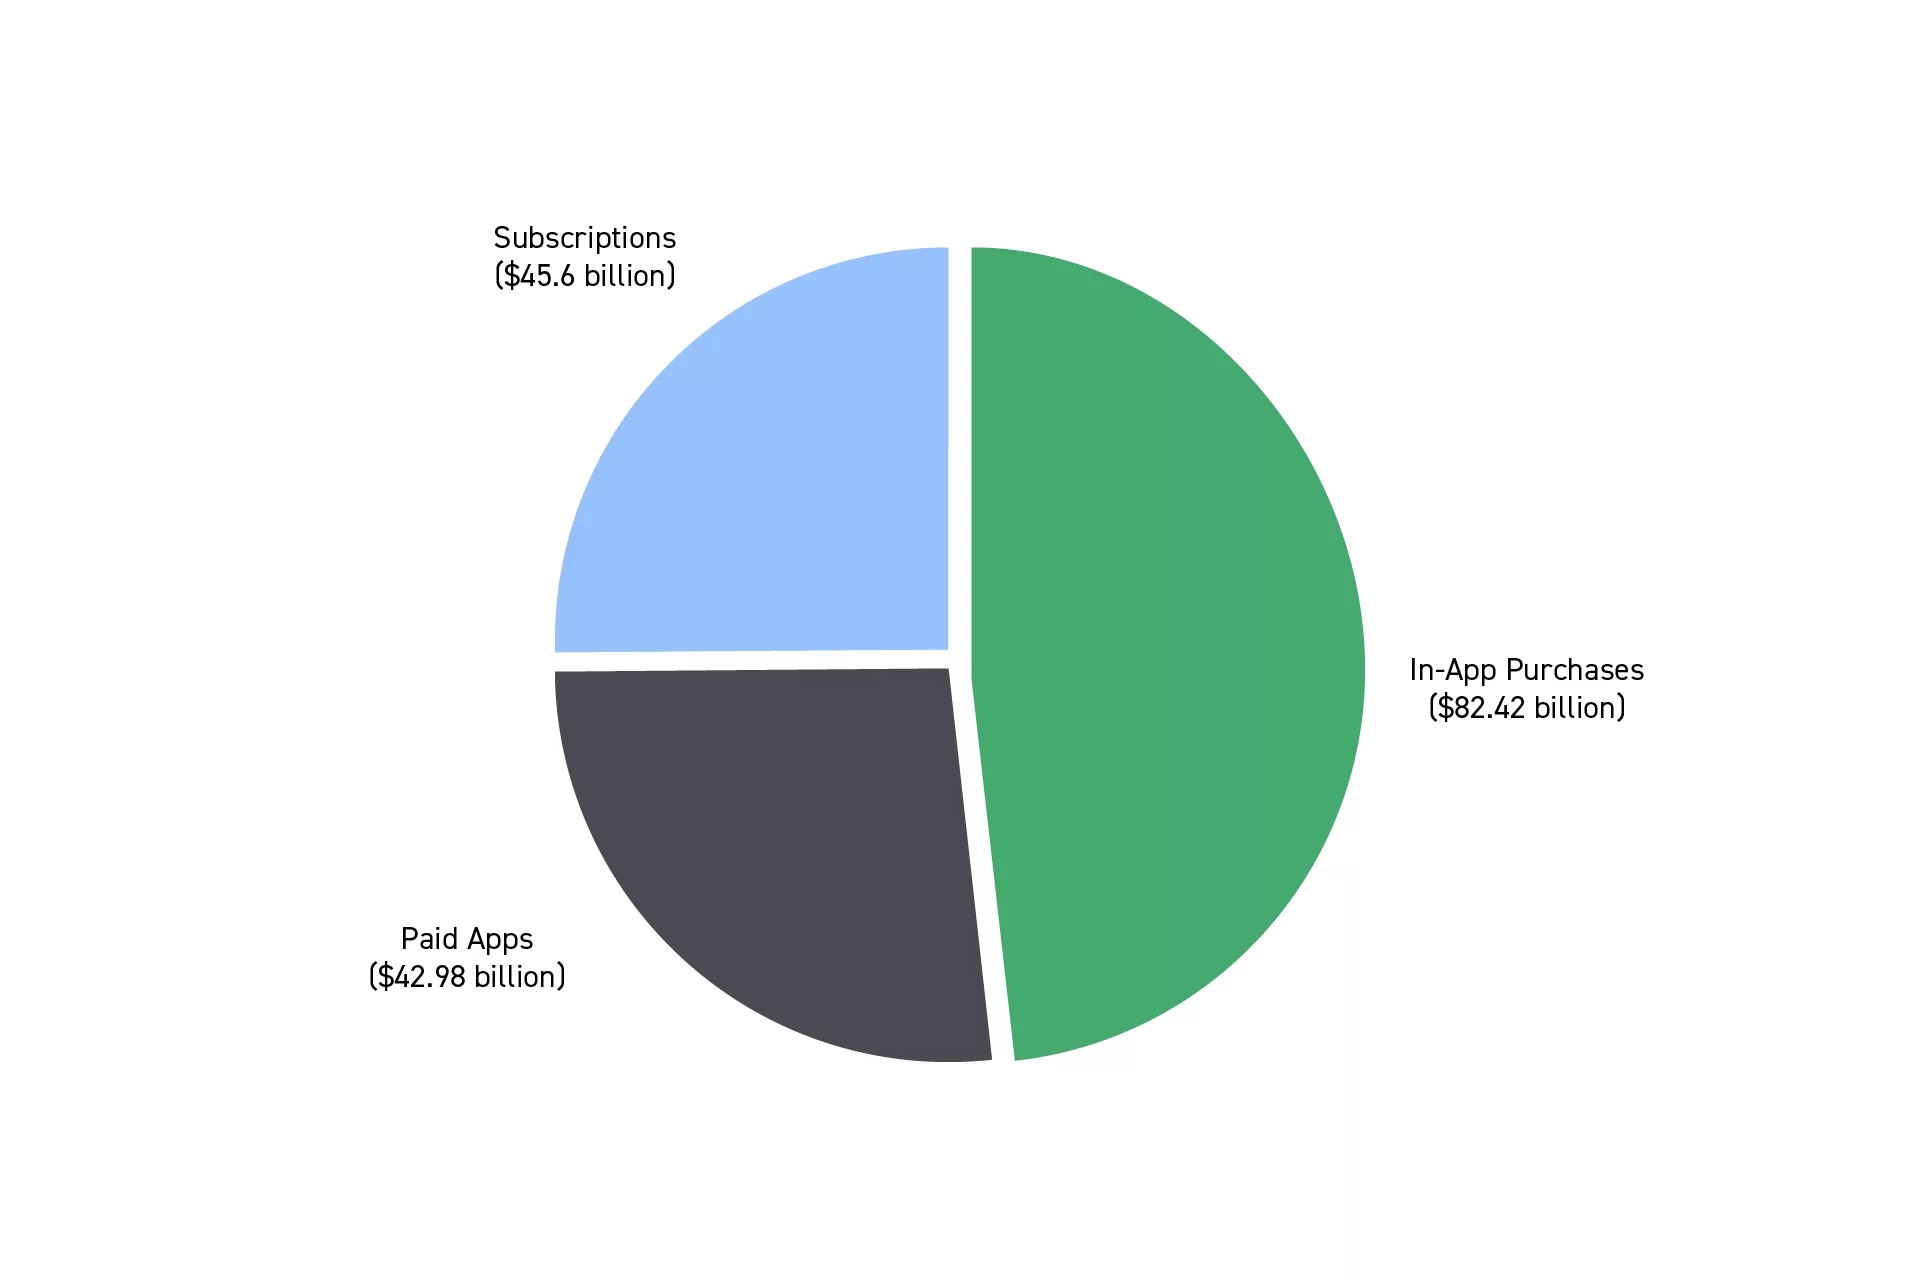
Direct downloads account for $42.98 billion; In-App Purchases for $82.42 billion and Subscriptions for $45.6 billion.
Sources: Data AI (2024), Business of Apps Subscriptions, Business of Apps In-App Purchases.
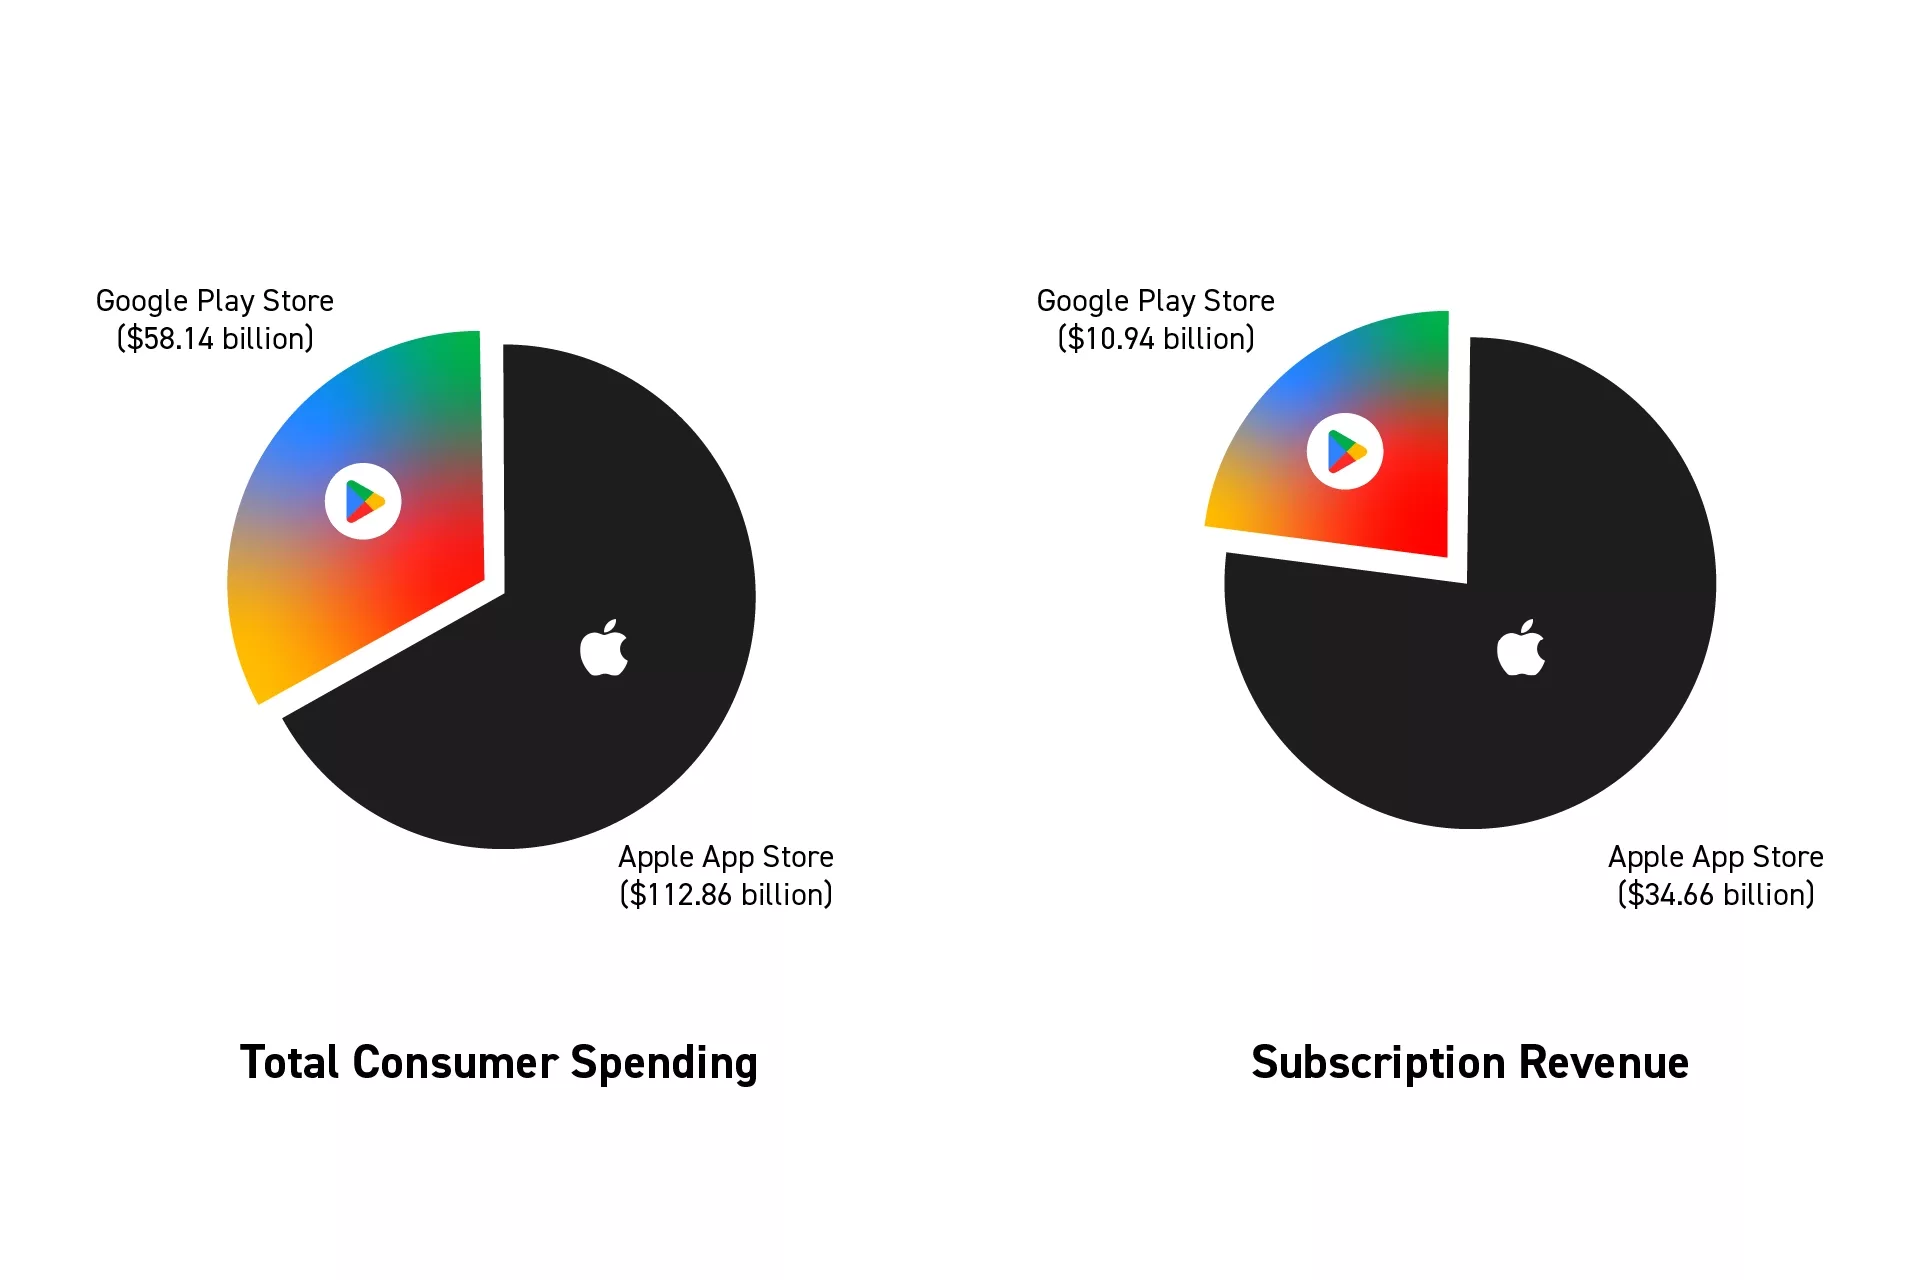
Apple's App Store was responsible for 66% of the total consumer spending ($112.86 billion) and 76% of subscription revenue ($34.66 billion), compared to the Google play store ($58.14 billion and $10.94 billion).
Sources: Data AI (2024), Business of Apps Subscriptions, Business of Apps App Revenue.
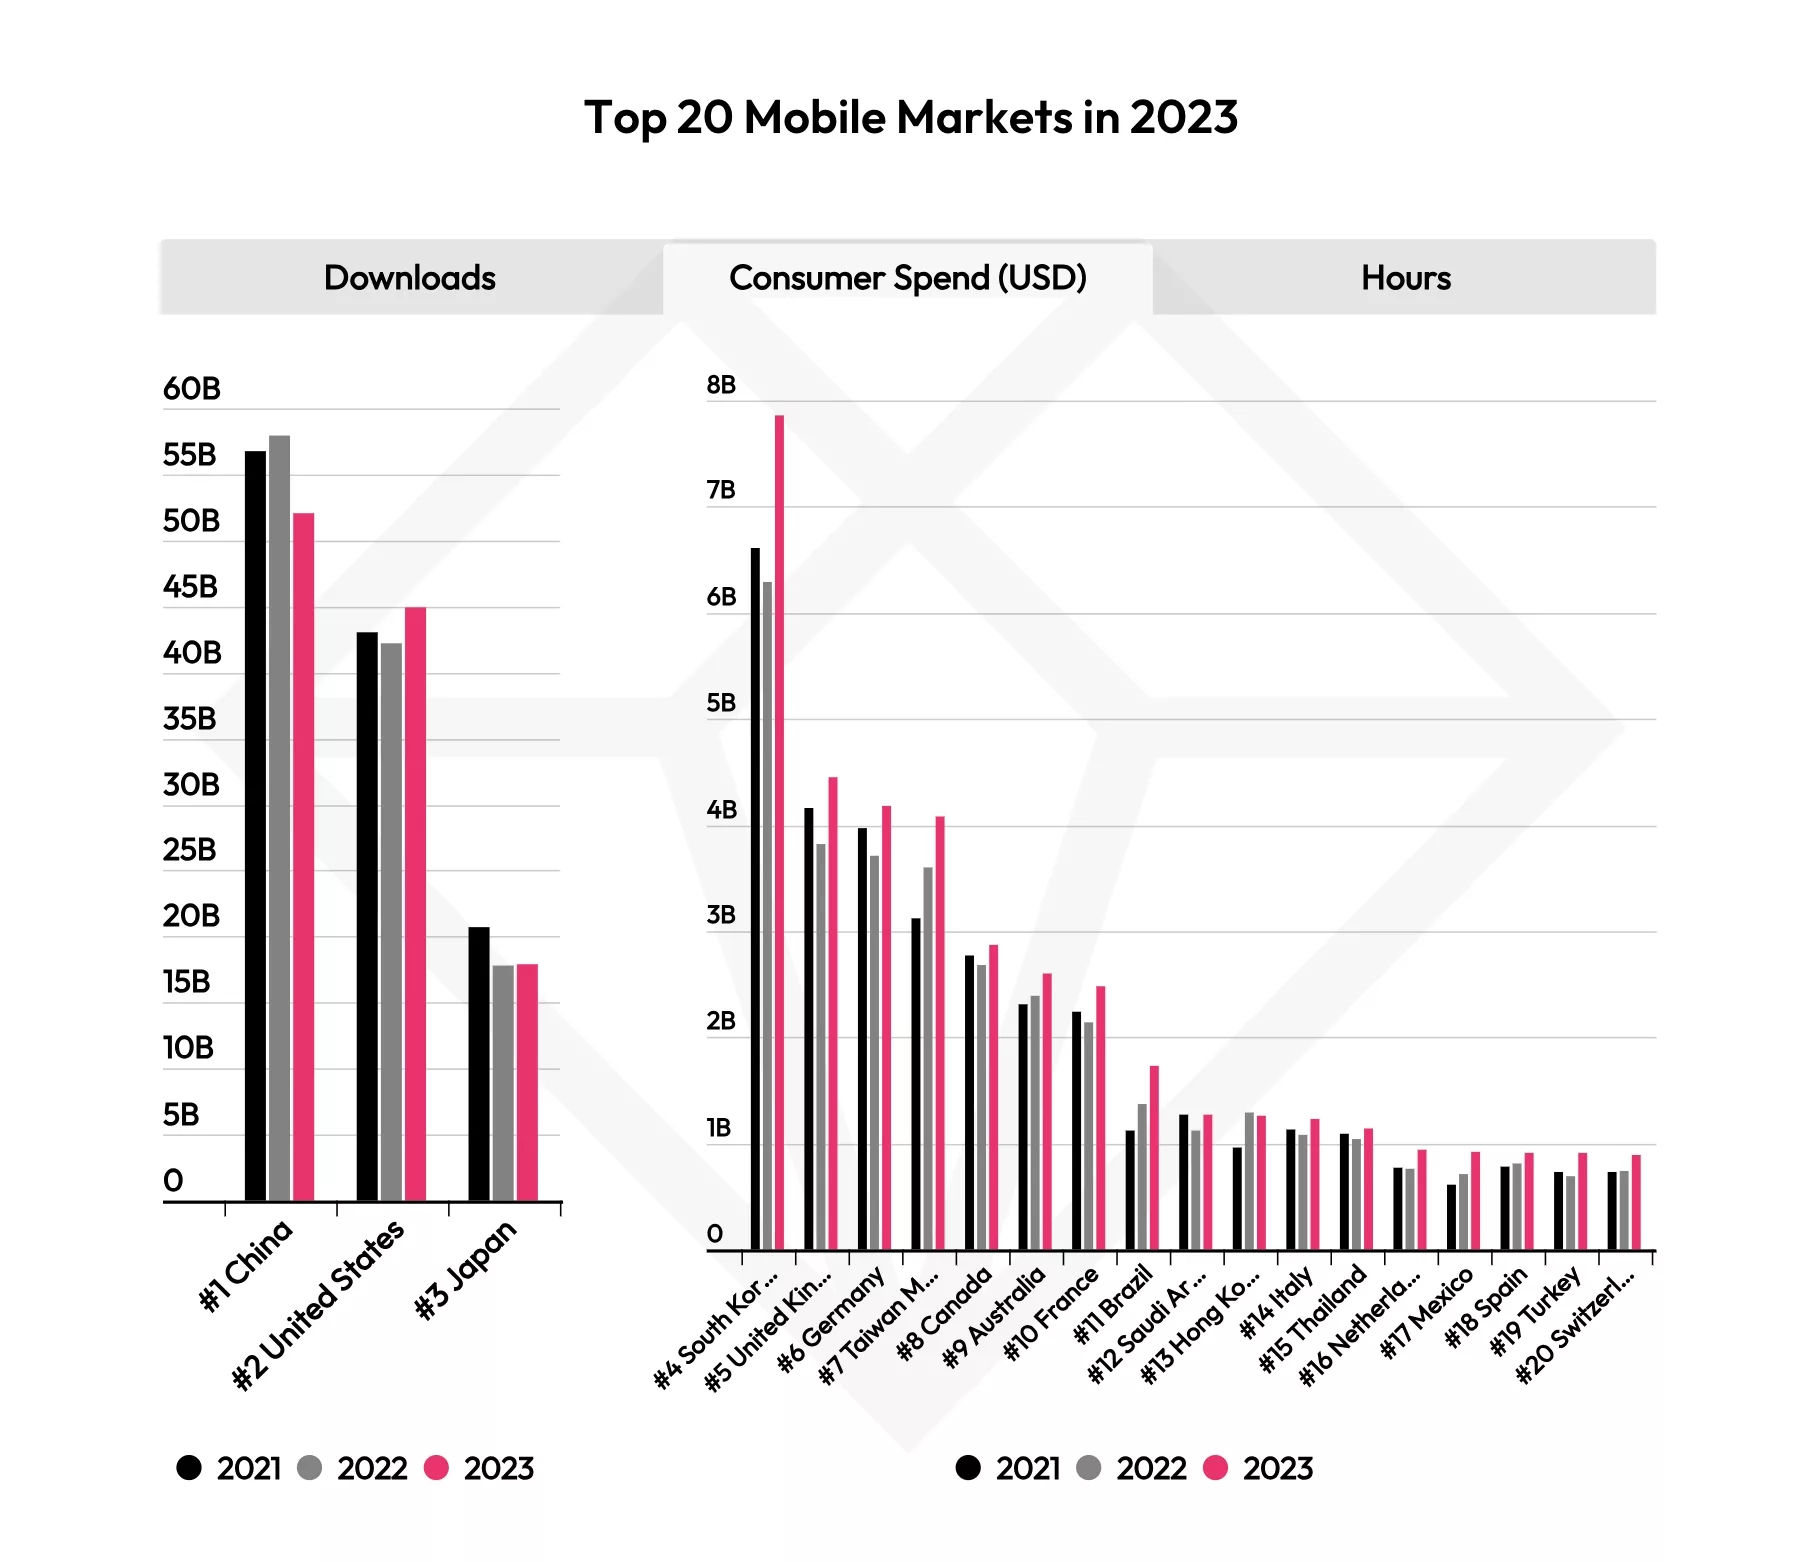
China ($50+ billion/year), United States ($45+ billion/year) and Japan ($15+ billion/year) are the worlds largest markets and make up over 65% of revenue.
Source: Data AI (2024)
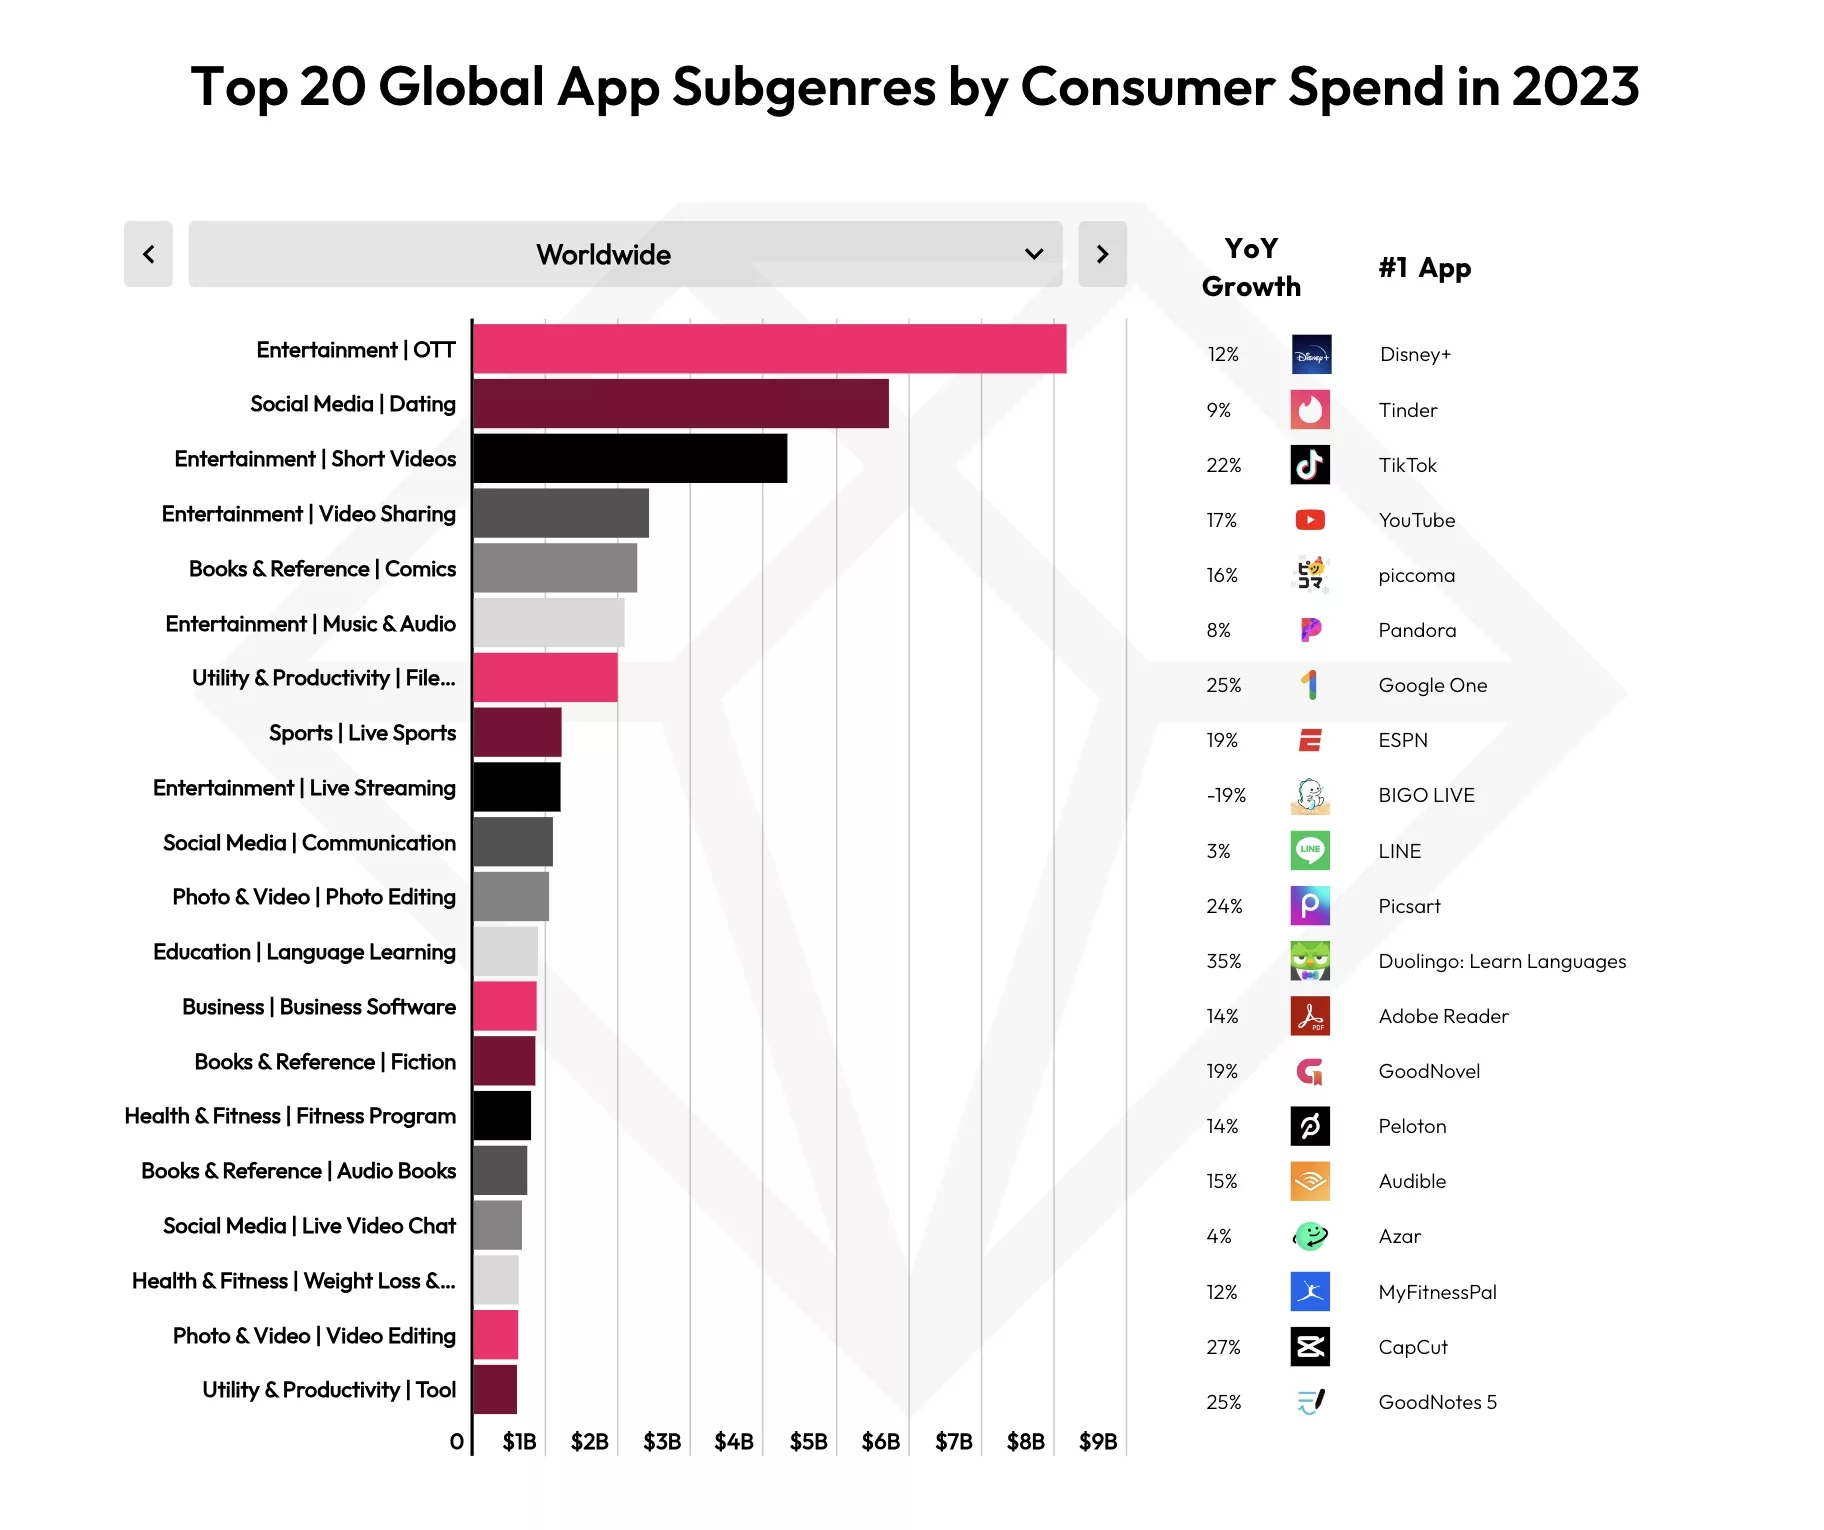
The most popular consumer spending categories are Entertainment (OTT), Social Media (Dating) and Entertainment (Short Video); with the most popular apps being Disney+, Tinder and TikTok.
Please note that when prioritizing regions for launch or localization, you should carry out further research into the specific category, as in the case of Health & Fitness, more than half of consumer spending comes from the United States.
To understand the top performer or to get a holistic breakdown of a category, please consult Data AI's report using the link below.
Source: Data AI (2024)
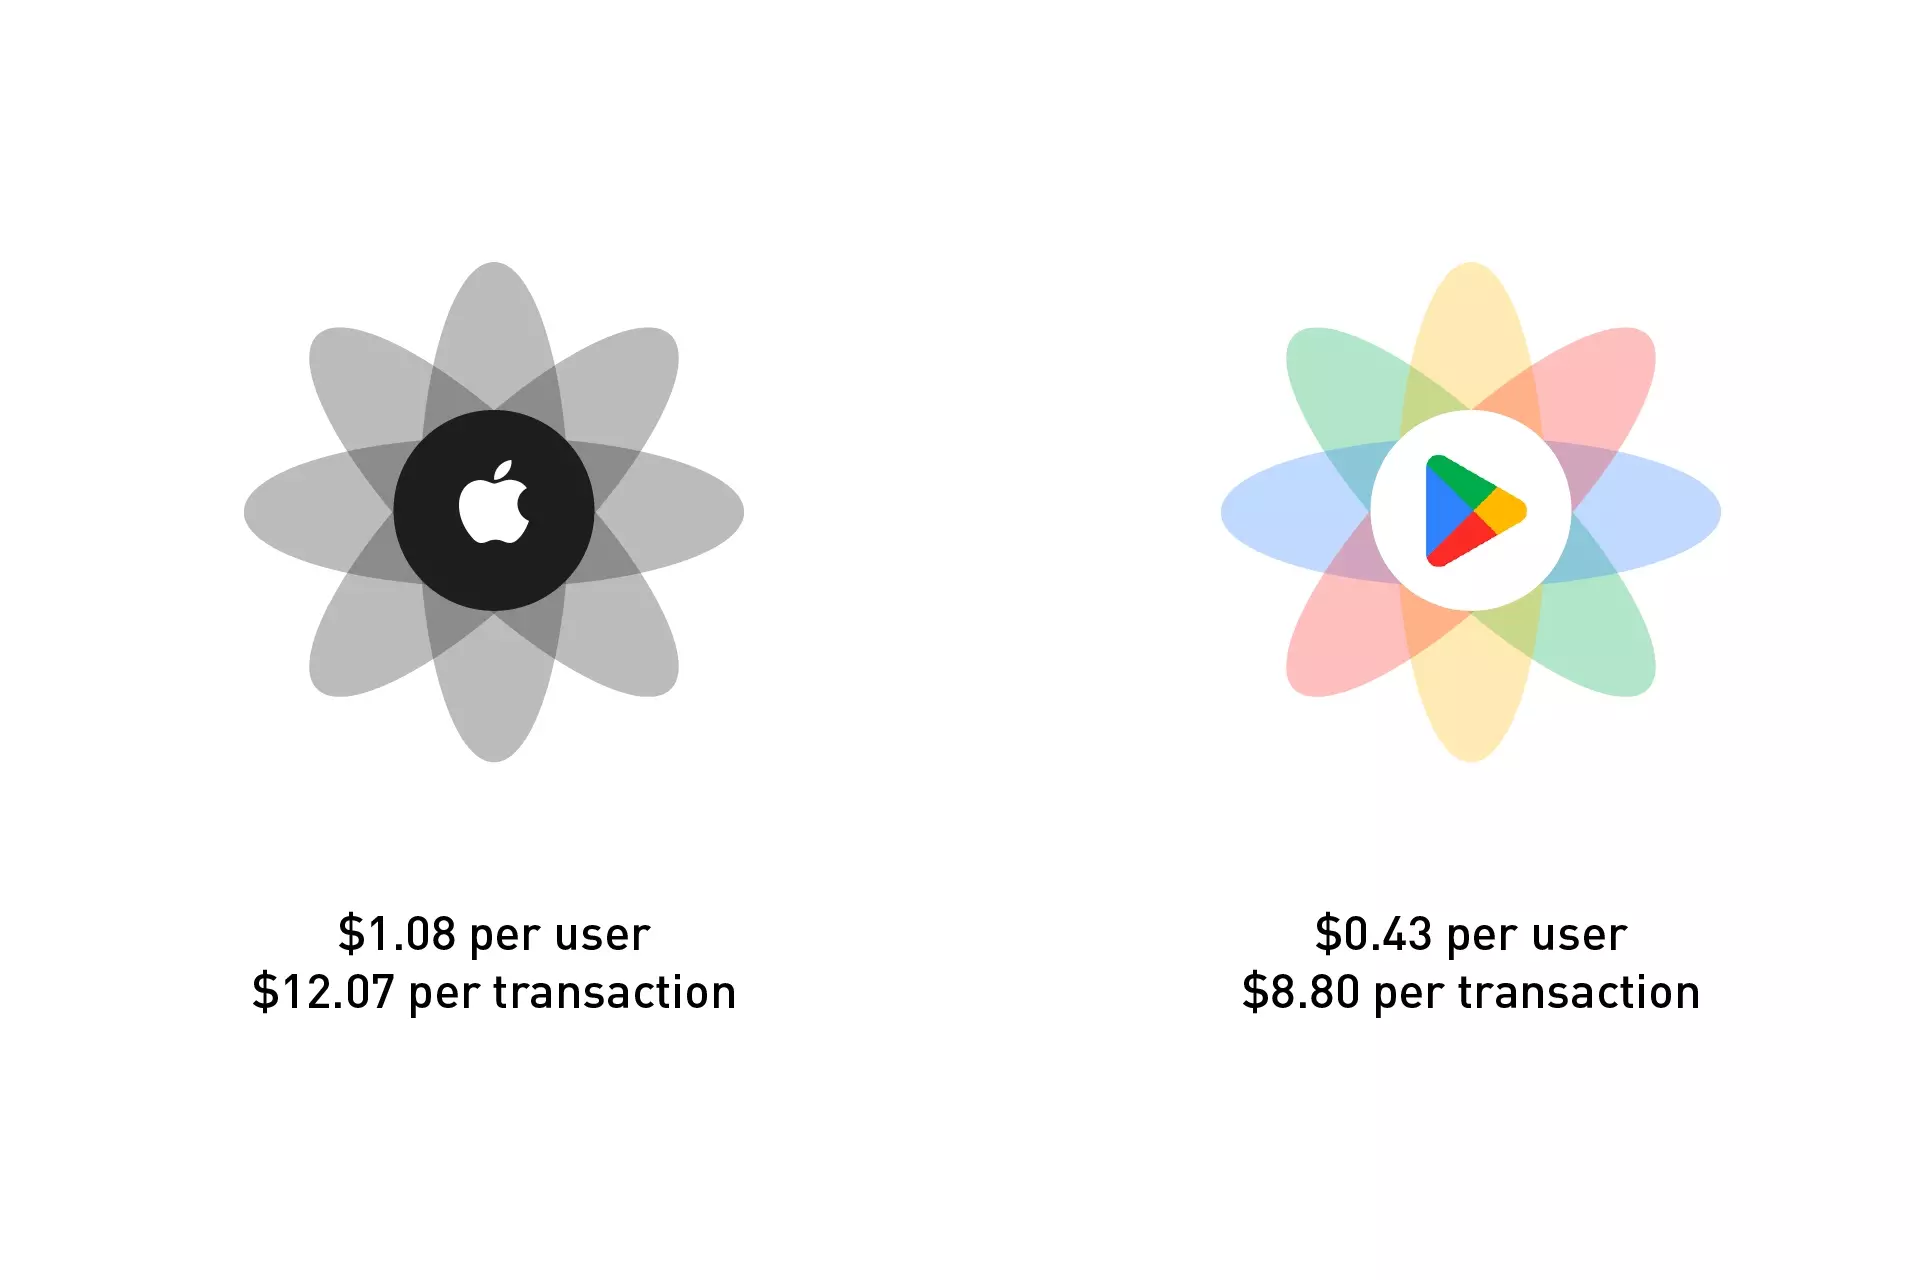
~5% of users invest in In-App Purchases with the average consumer spending:
- $1.08 in In-App Purchases per user on the Apple App Store; at an average of $12.07 per transaction.
- $0.43 in In-App Purchases per user on the Google Play Store; at an average of $8.80 per transaction.
Source: Business of Apps
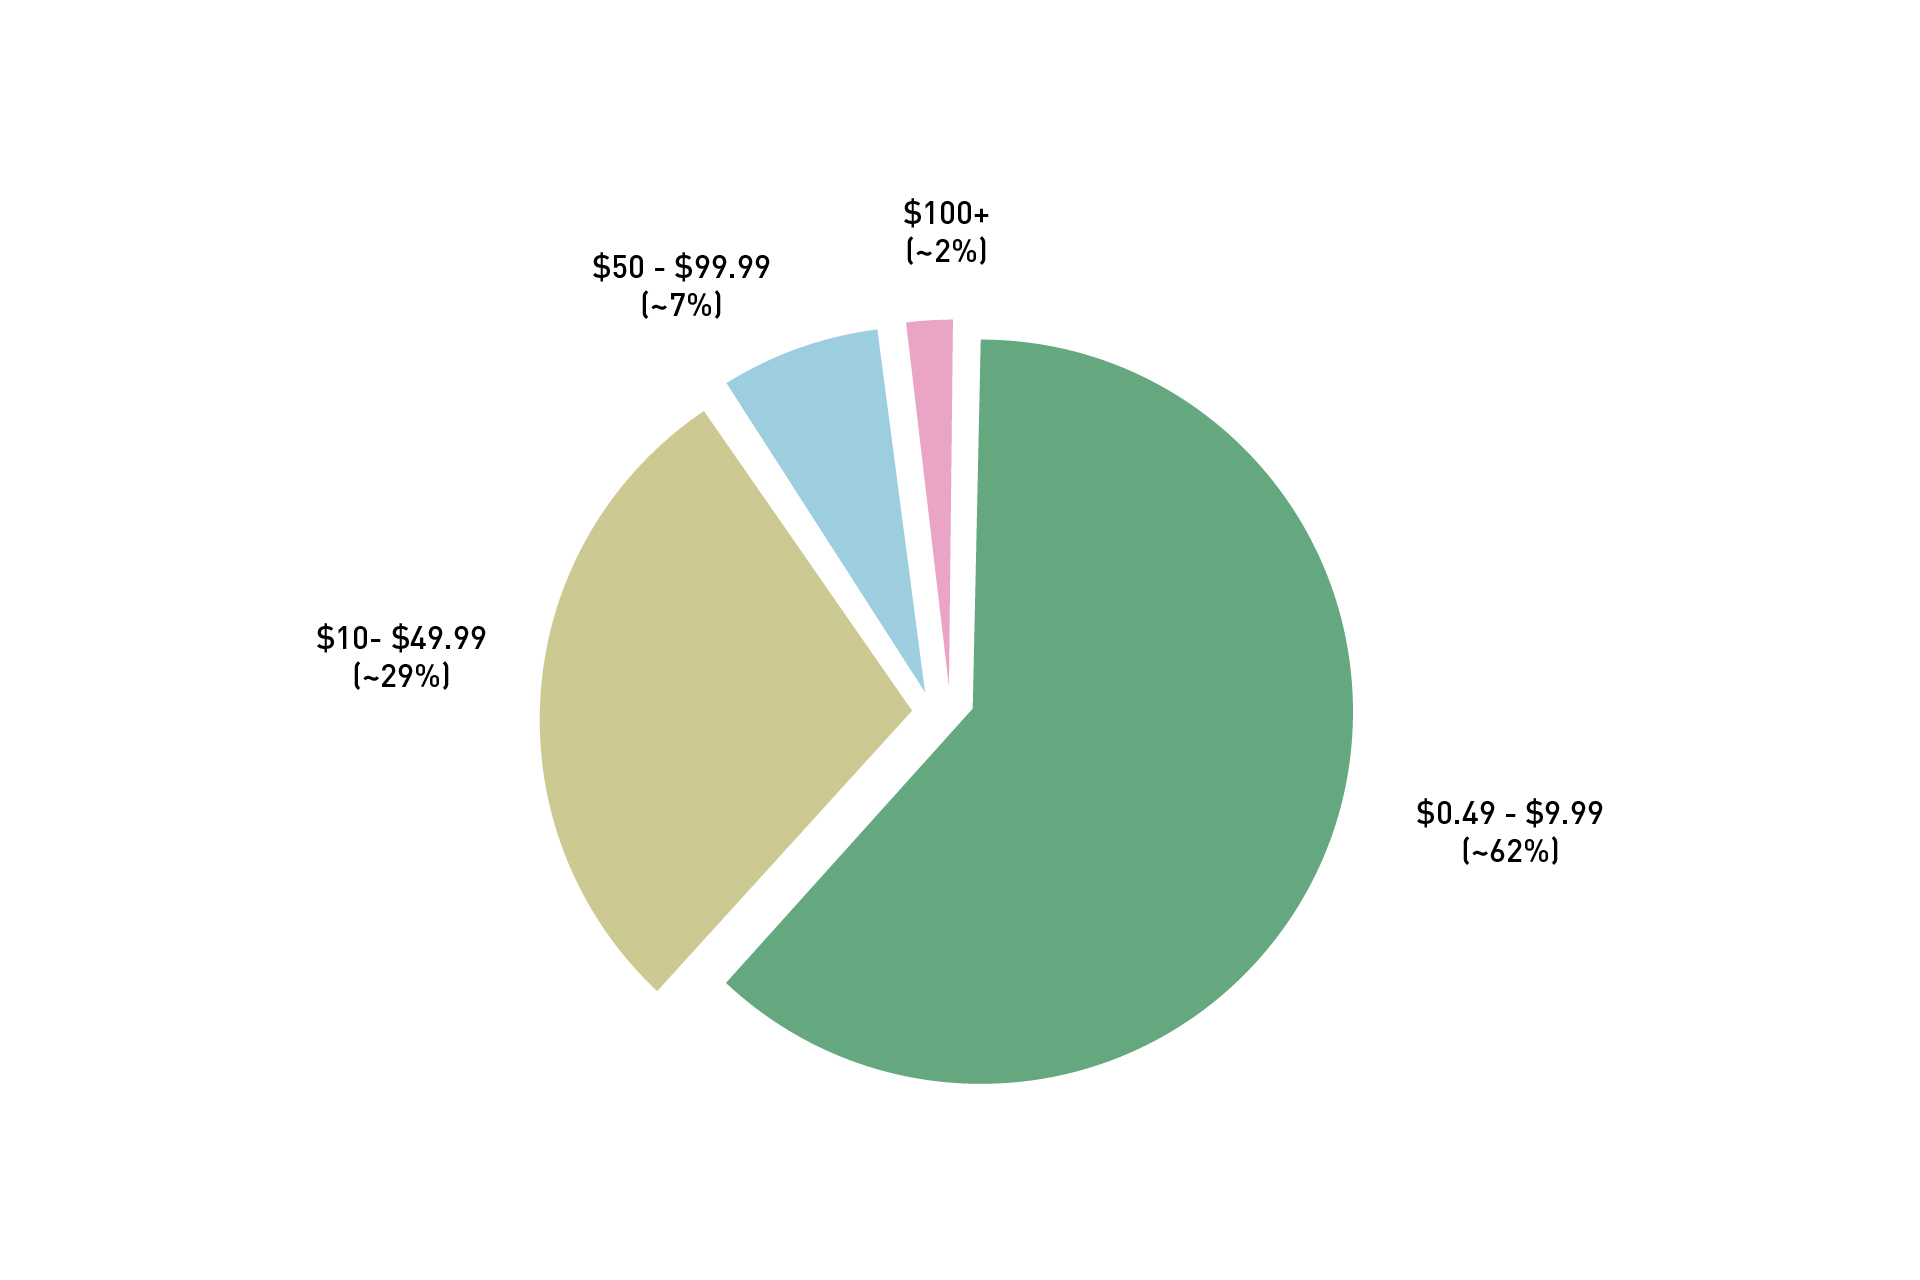
Over 60% of all In-App Purchases cost between $0.49 to $9.99.
The remaining categories are $10-$49.99 (~29%), $50-$99.99 (~7%) and $100+ (~2%).
Source: Business of Apps
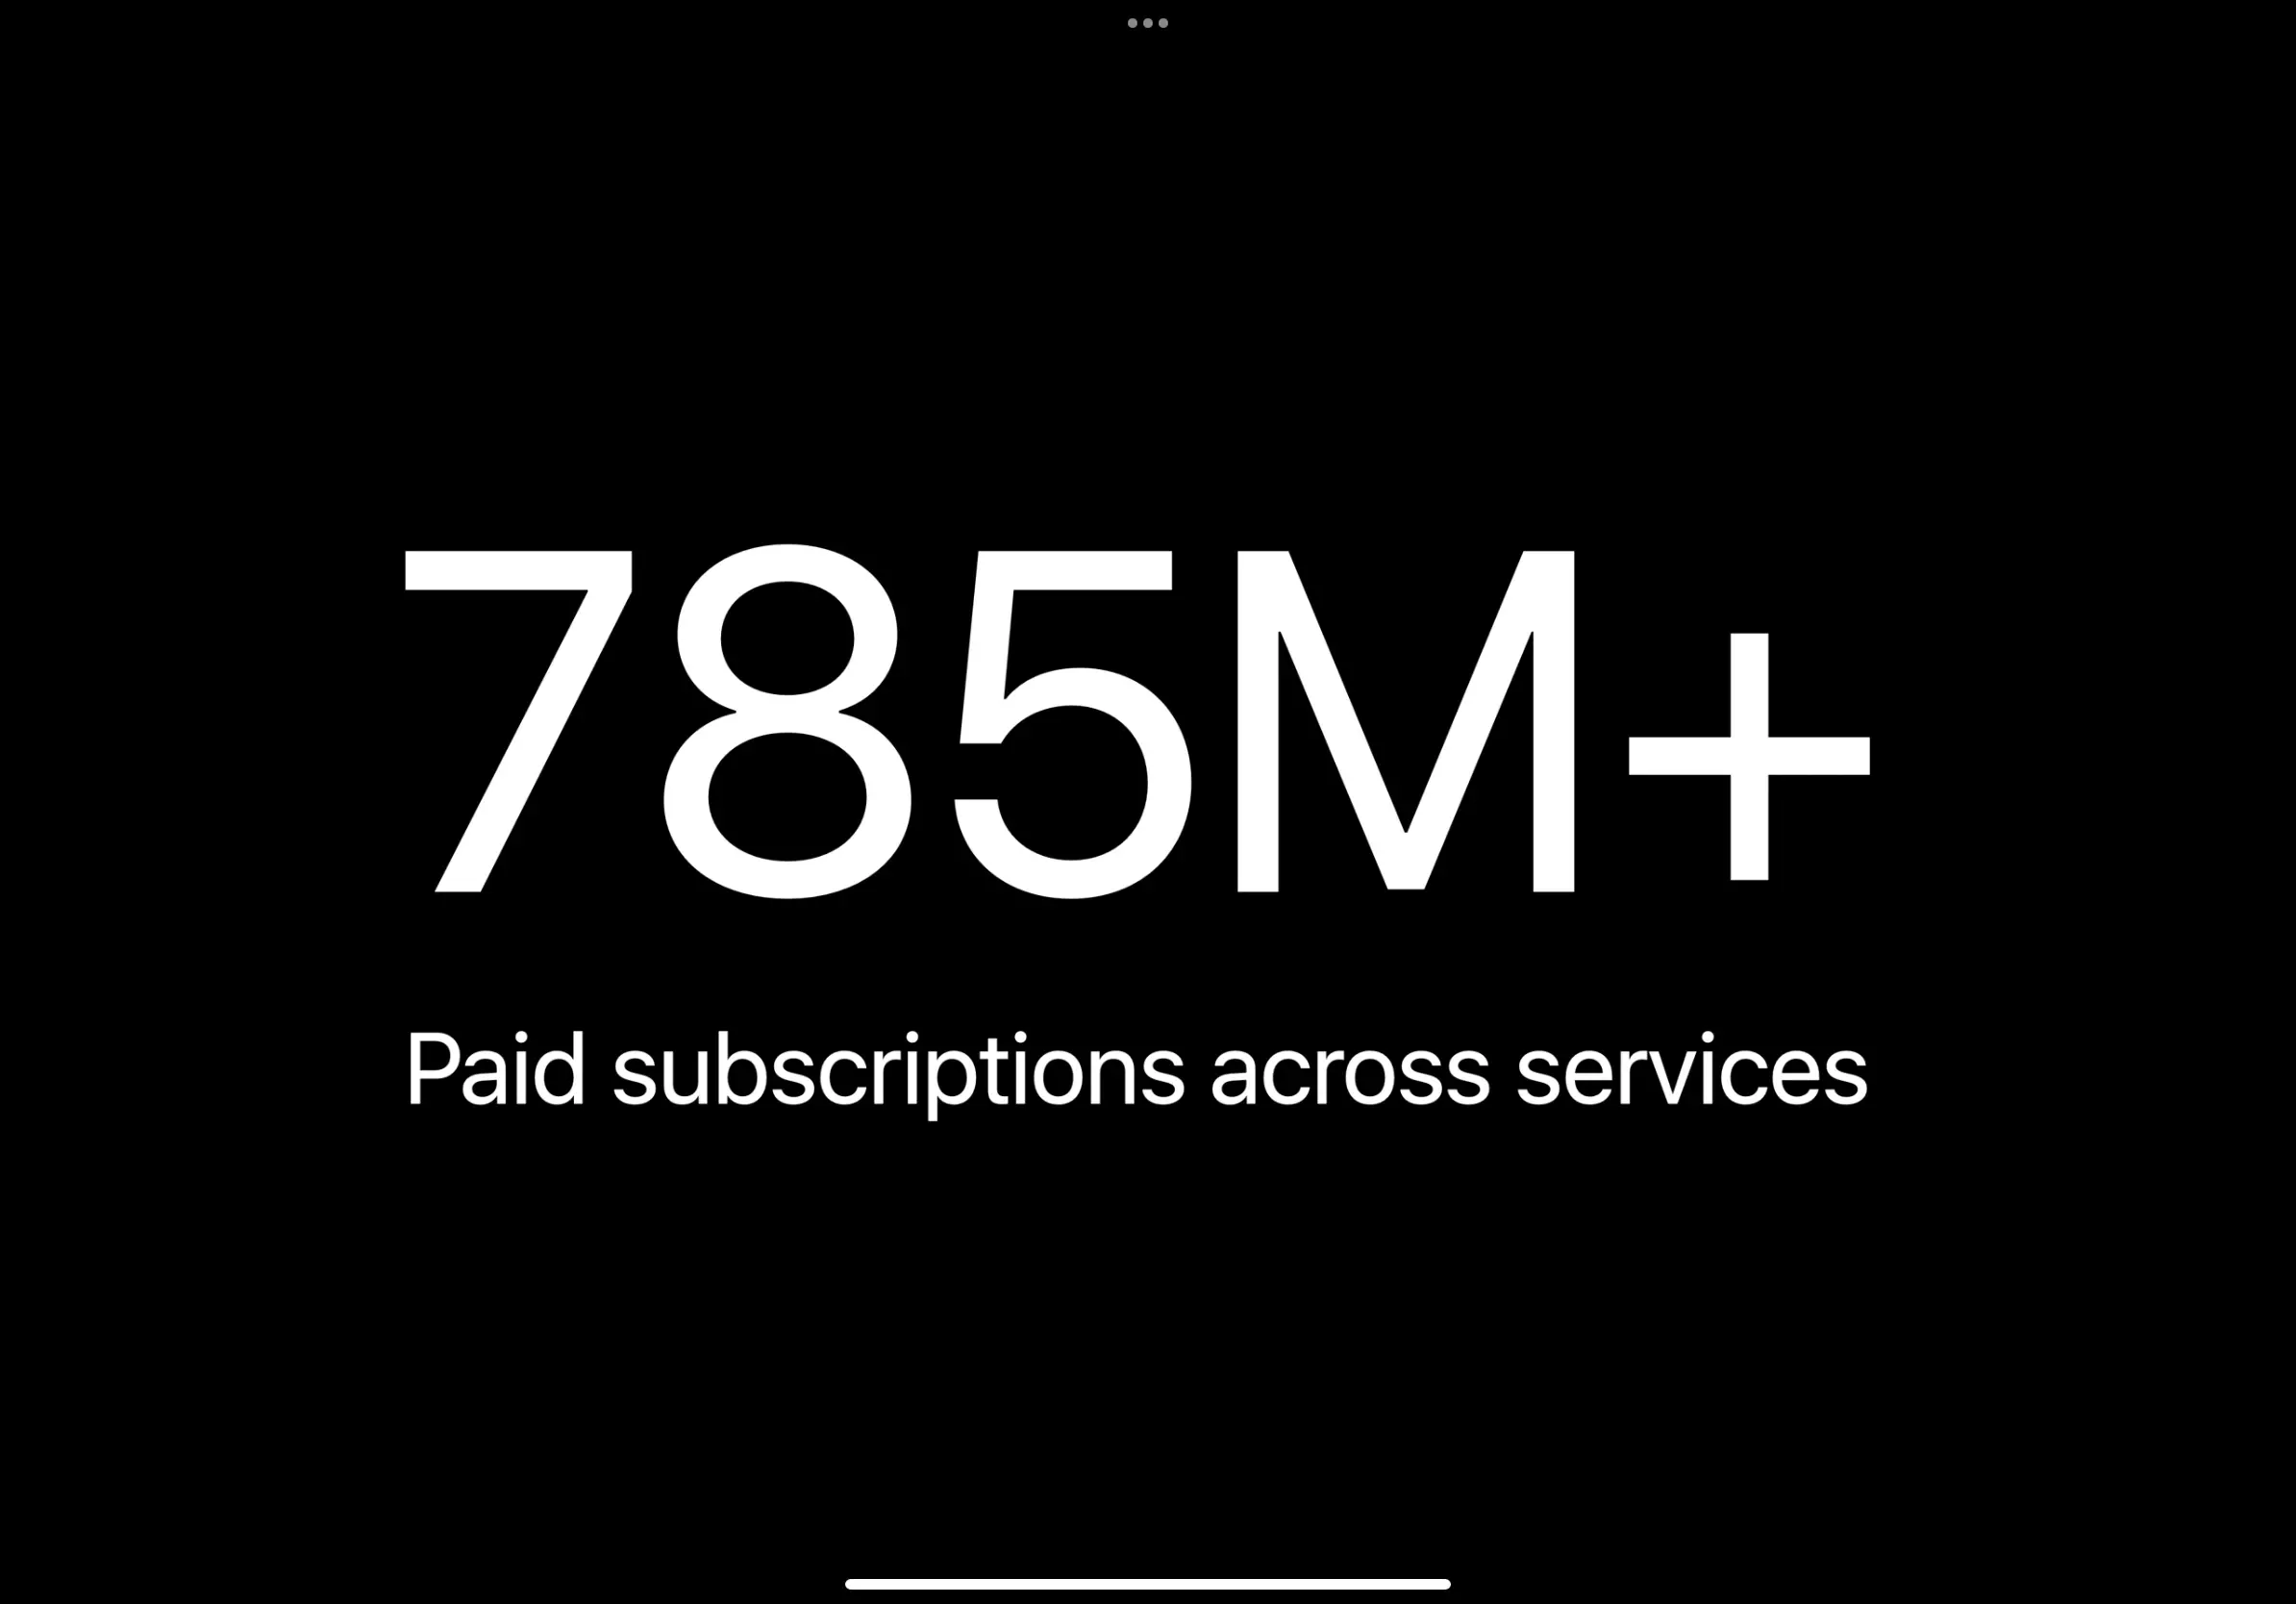
Apple have 785+ million active subscriptions across apps (Apple Talks: Optimize Subscriptions for Success: Acquisition), Google did not disclose.
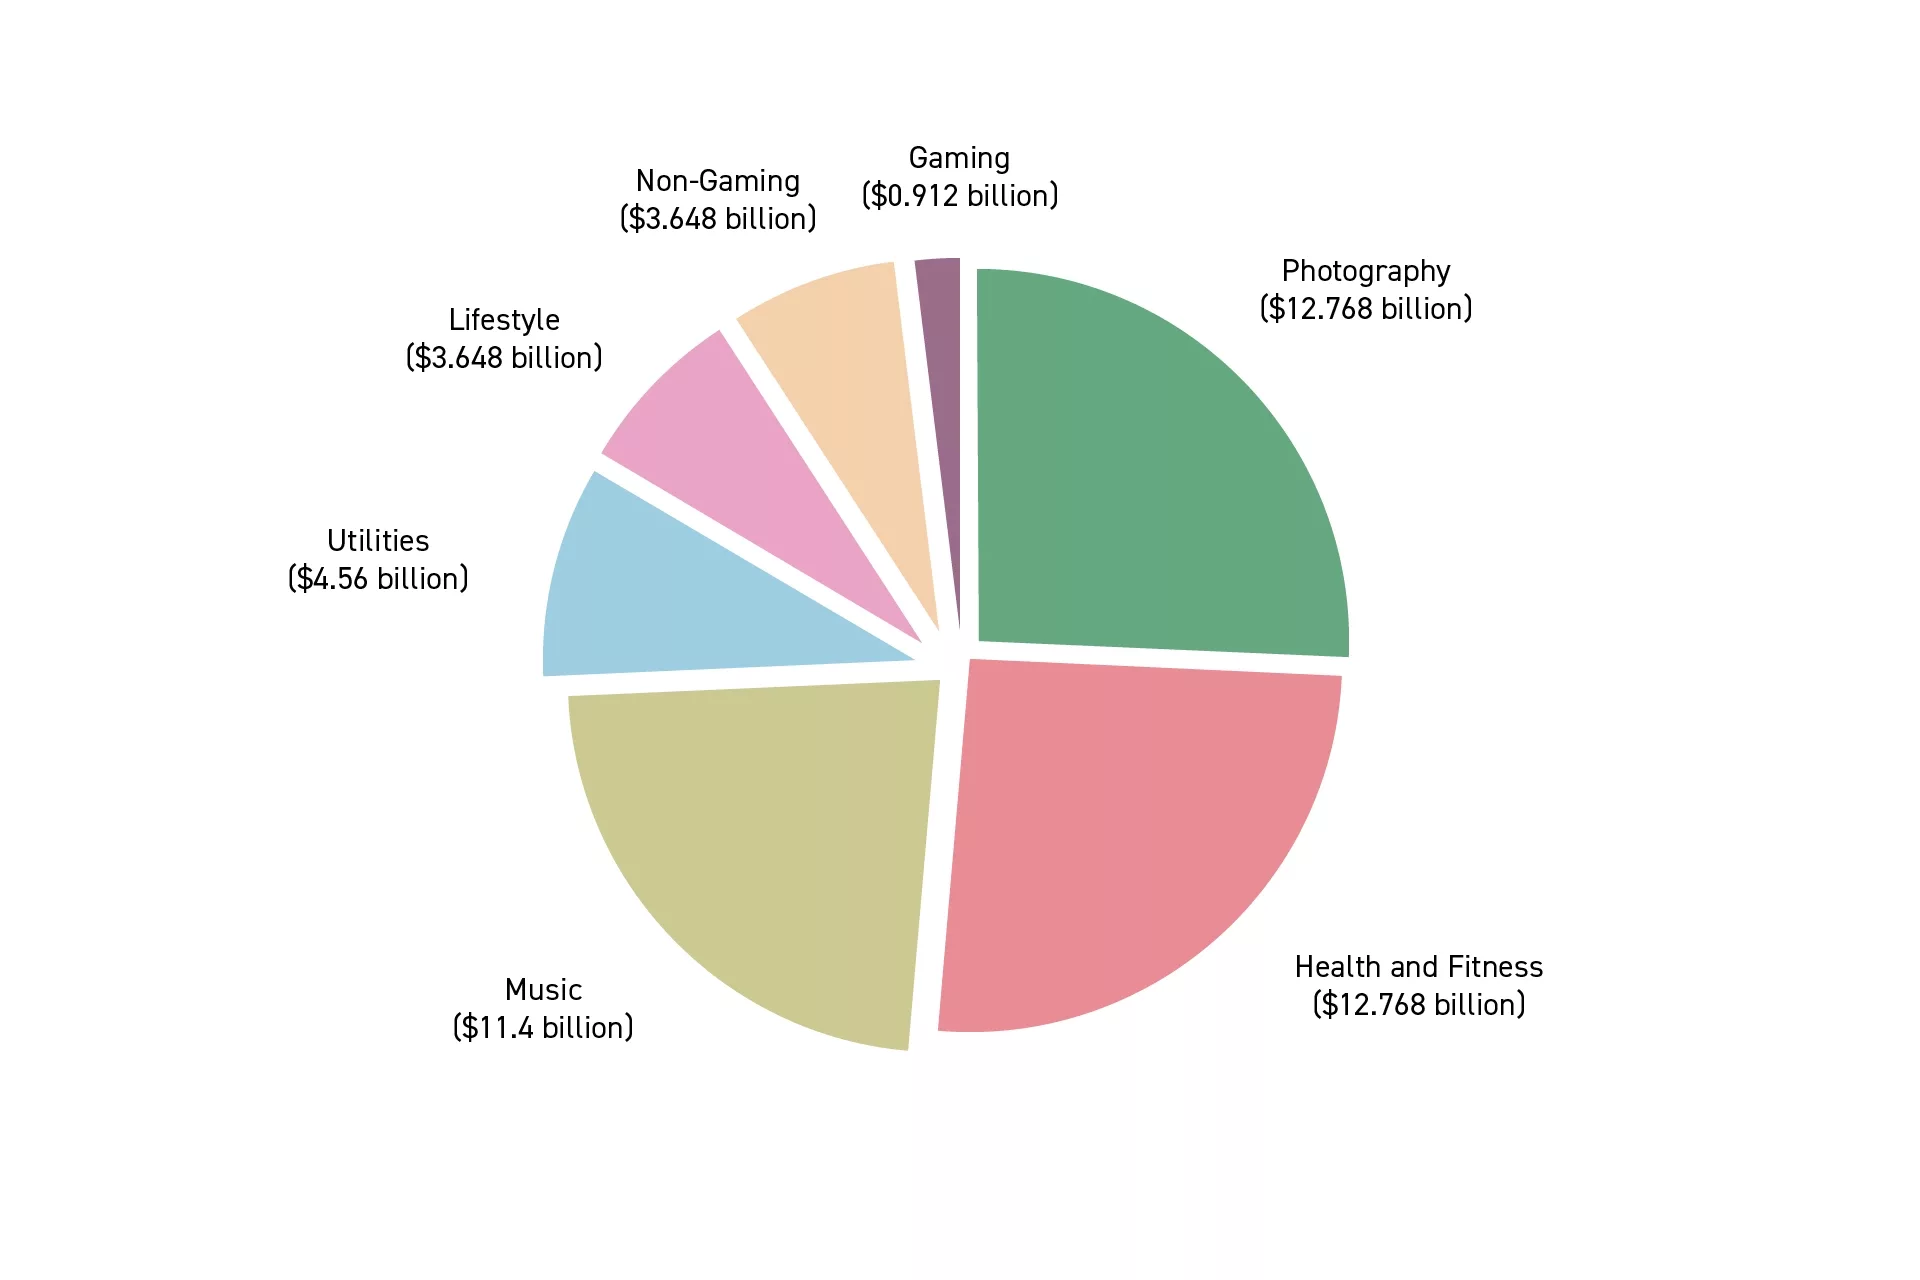
The subscriptions market is dominated by Photography (28%), Health and Fitness (28%) and Music apps (25%), which collectively bring in 81% of all subscriptions (approximately $39.936 billion).
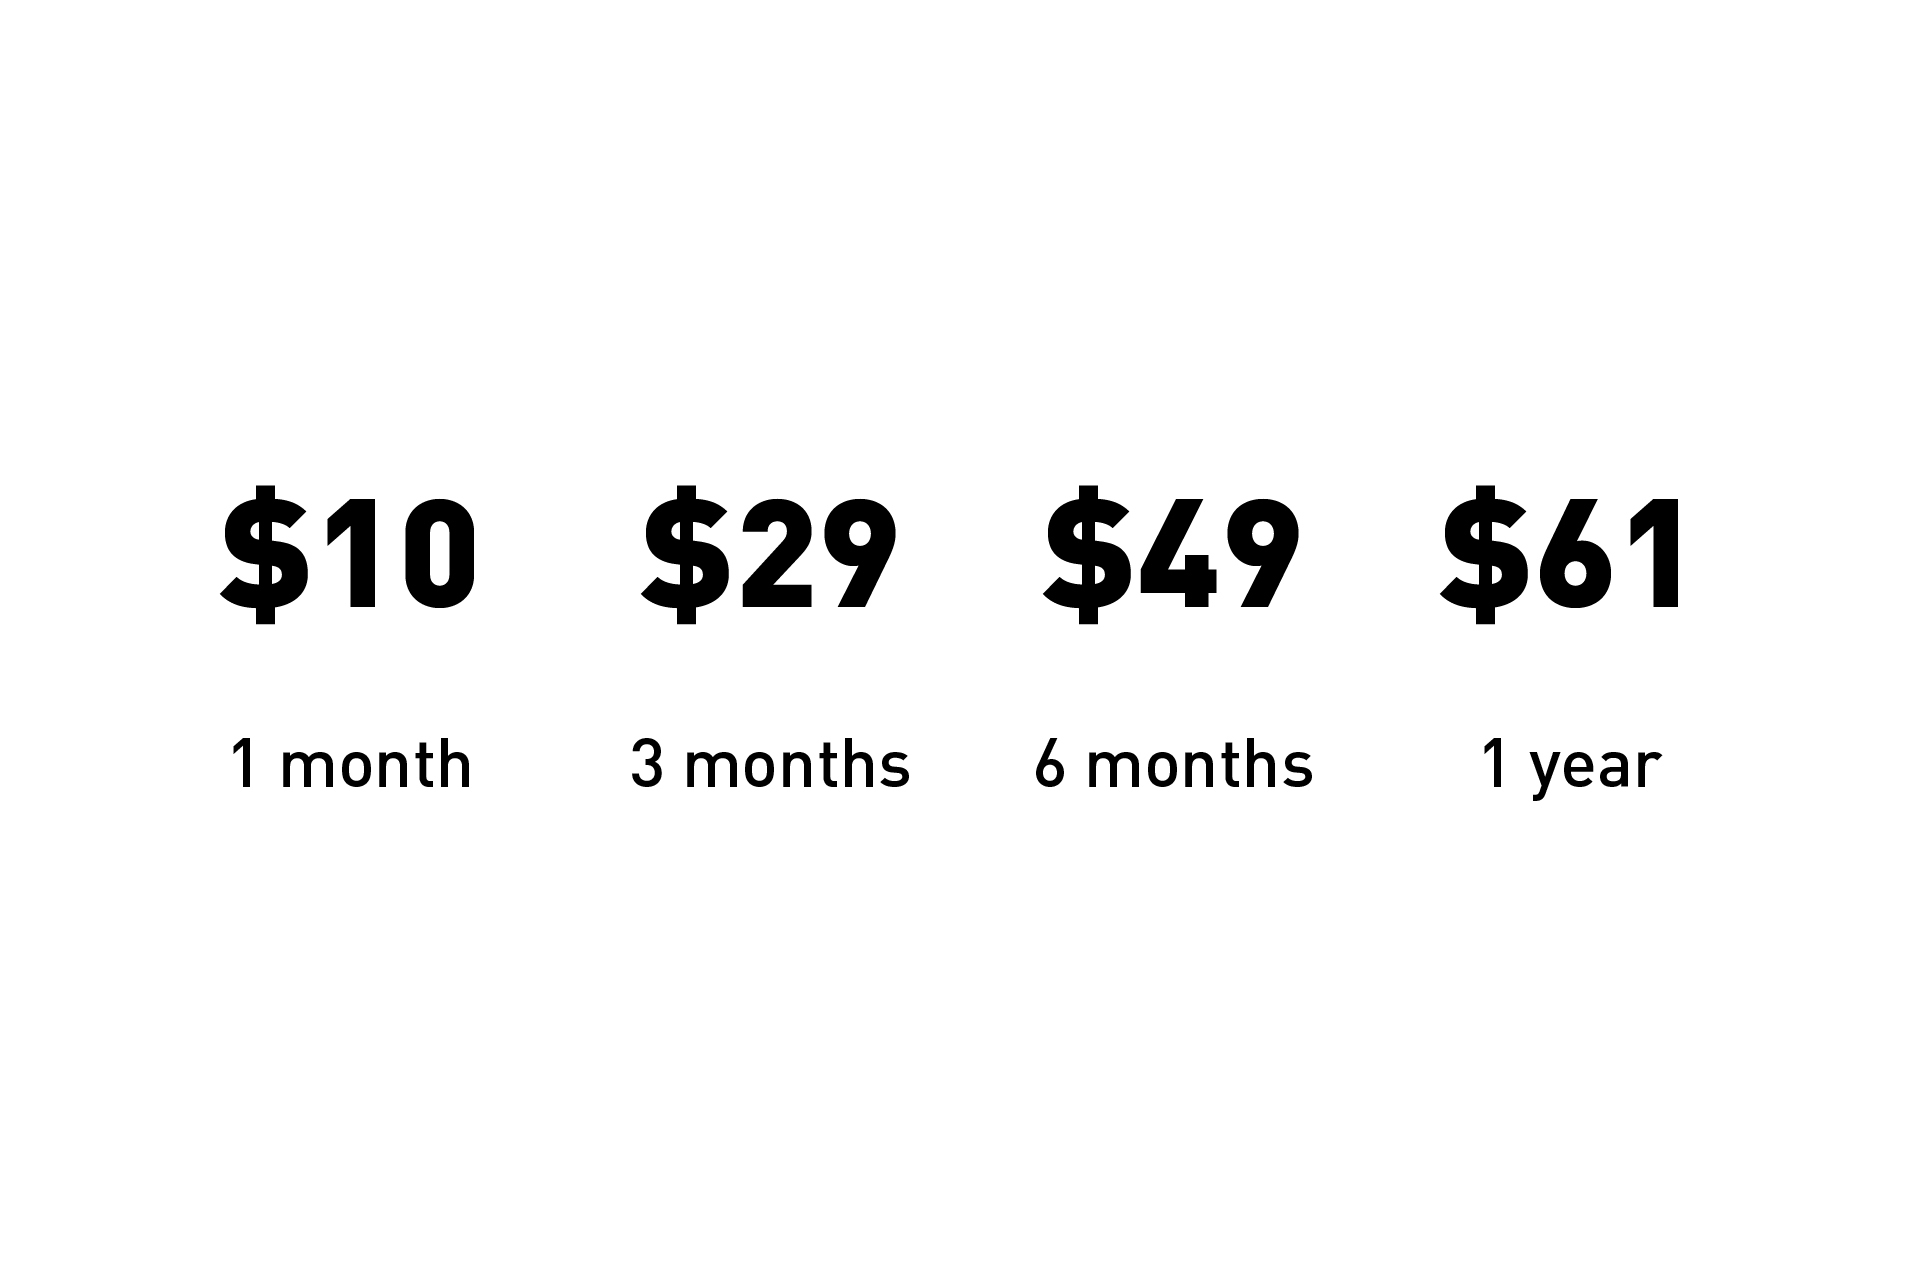
7.1% of consumers make a monthly payment on App Stores, with the average subscription prices for popular subscription periods being:
- $10/month.
- $29/3 months
- $49/6 months
- $61/year
Source: Business of Apps
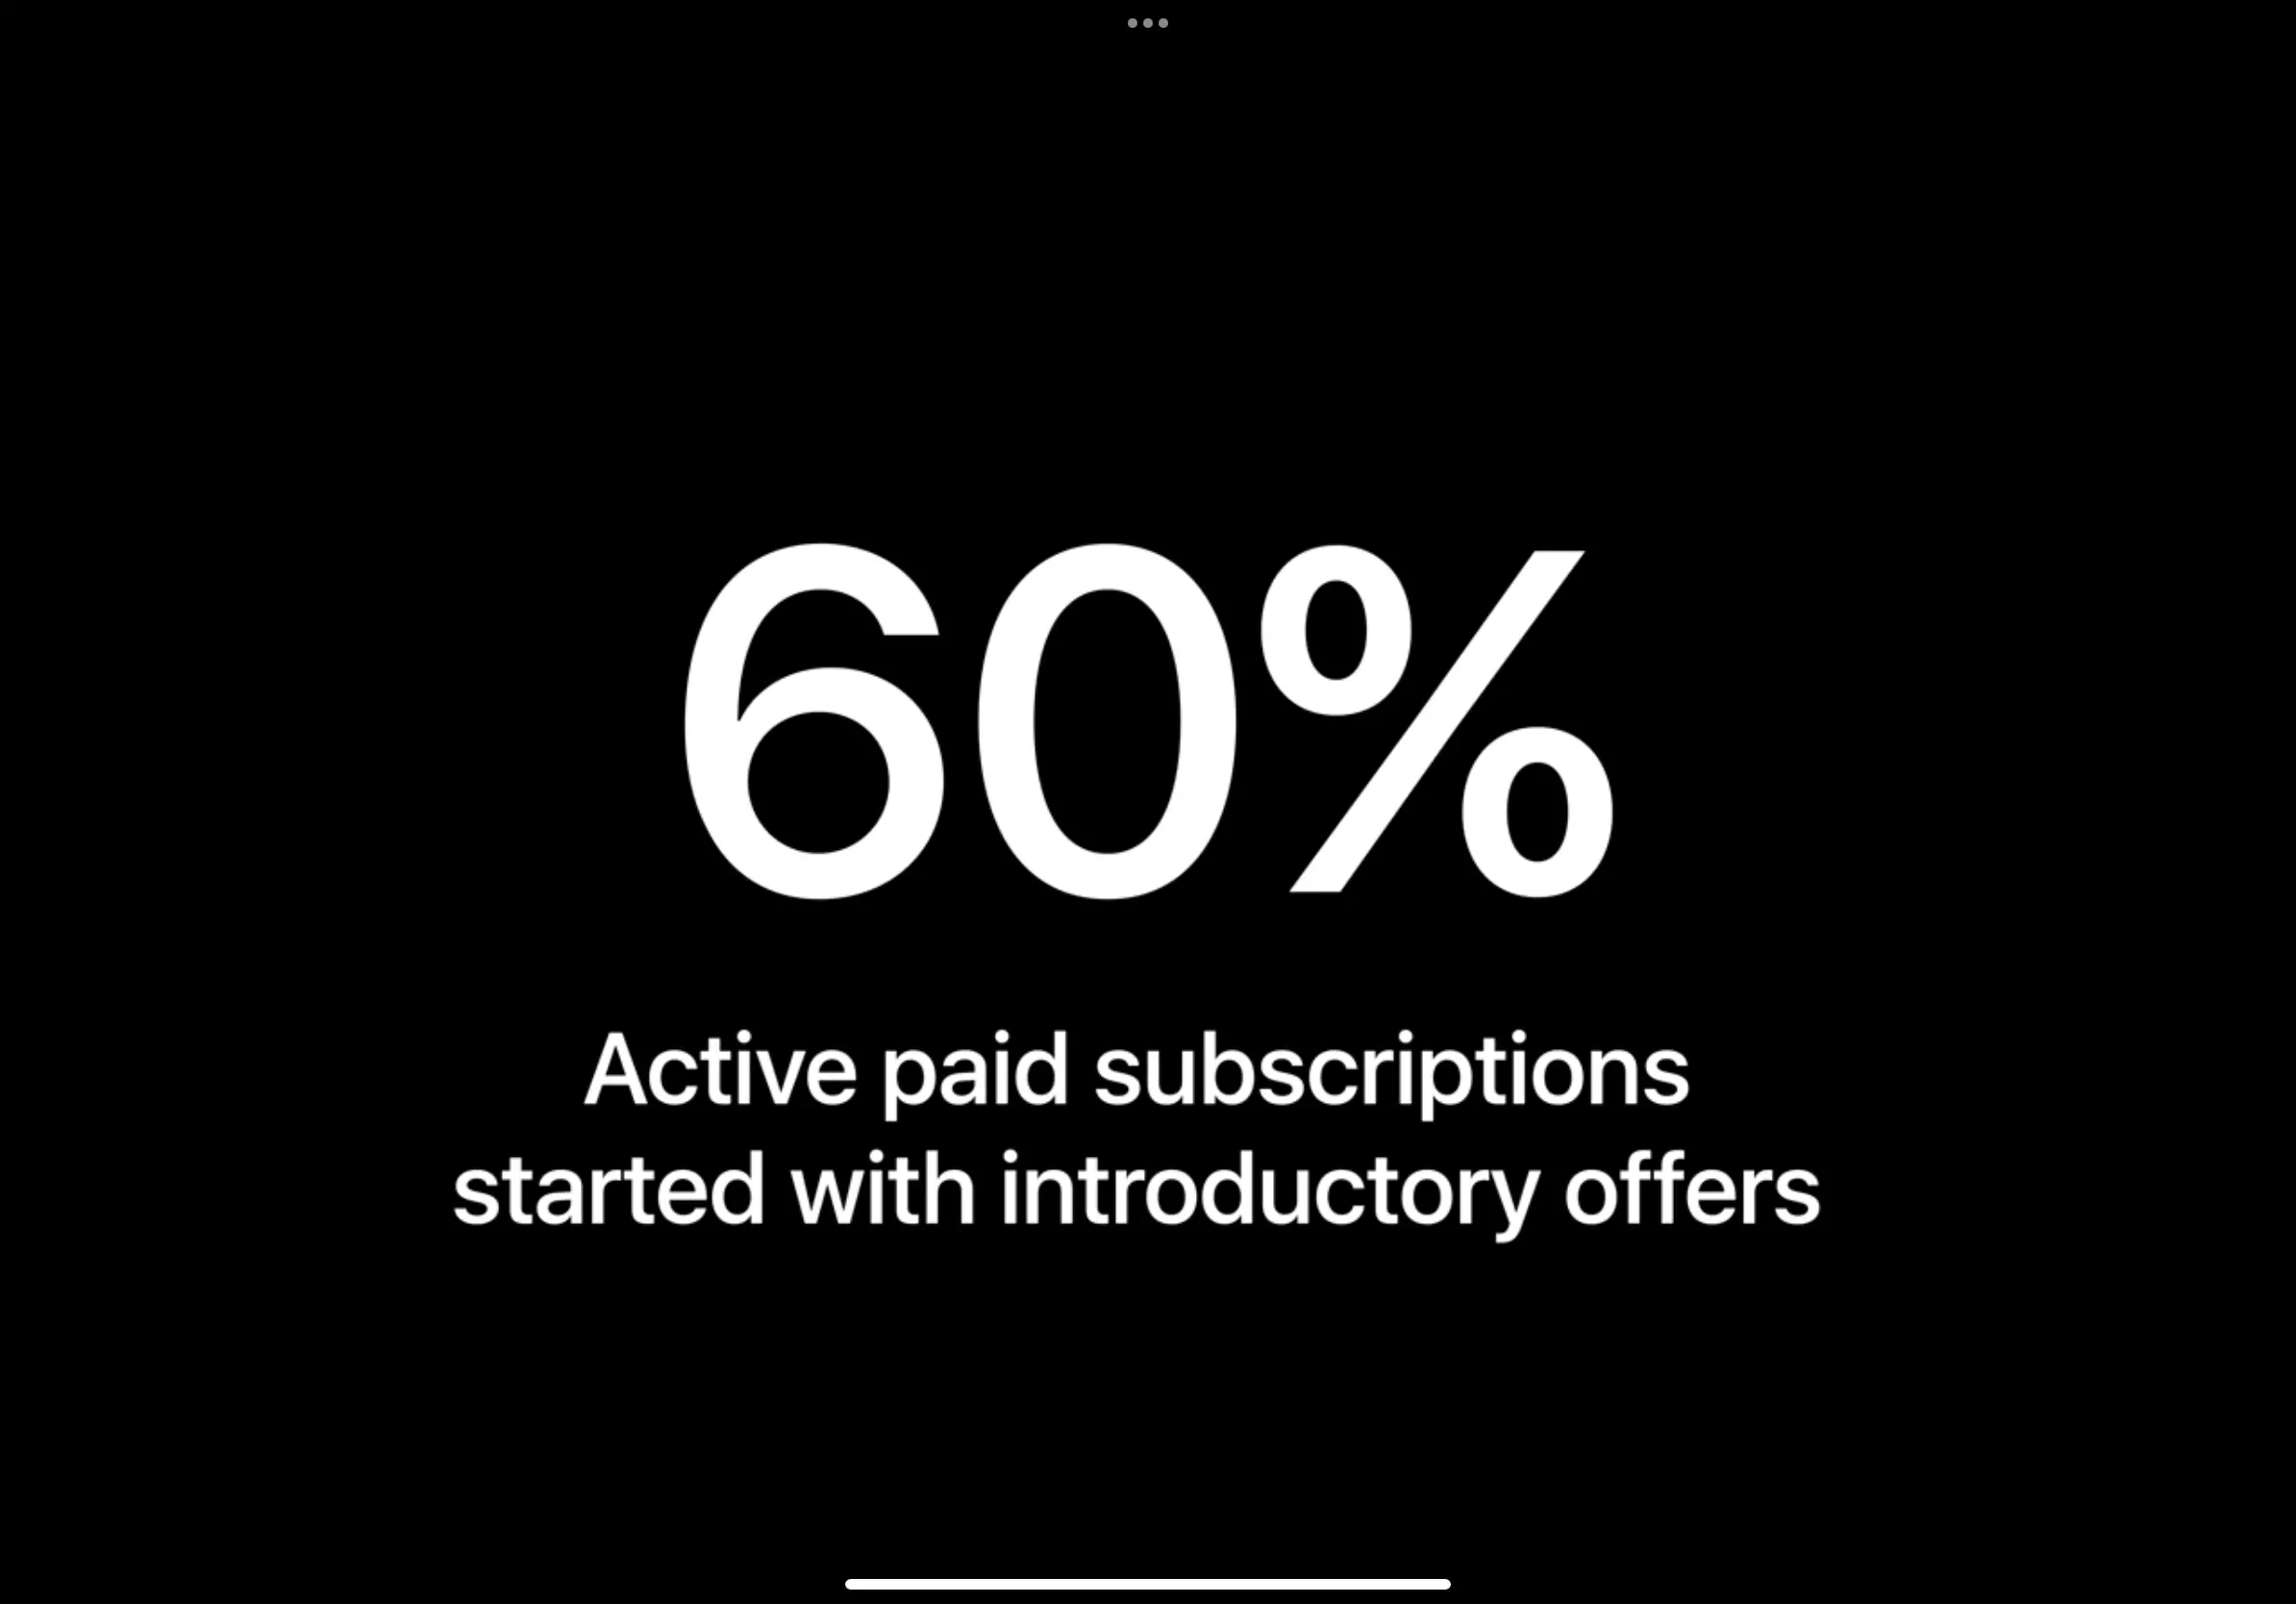
As 60% of active subscriptions began with an introductory offer, we recommend reading our article on Popular Offer Mechanics to understand the options that are available to businesses to acquire, retain and regain consumers; market behaviors and the best practices around offers.
Looking for more information on building e-commerce Apple apps?
Read our business guide to get our latest market and customer research, perspective and recommendations on building Apple e-commerce apps that use In-App Purchases and Subscriptions.